Bokeh Notebook — Geo Visualization
Overview
This template provides a production-ready setup for geospatial data analysis and interactive mapping on Saturn Cloud. Optimized for CPU resources, it demonstrates how to process geographic coordinates and render high-performance interactive maps using Bokeh.
Key features of Bokeh include:
- High Interactivity
- Browser-Based Rendering
- Handles Large Datasets
- Geospatial Mapping
- Integration
Why use this template?
Quickly build geospatial projects with built-in CRS transformations and interactive rendering. This Bokeh and GeoPandas foundation is ideal for mapping logistics, incidents, or environmental datasets out of the box.
Getting Started
- Simply log in to Saturn Cloud.
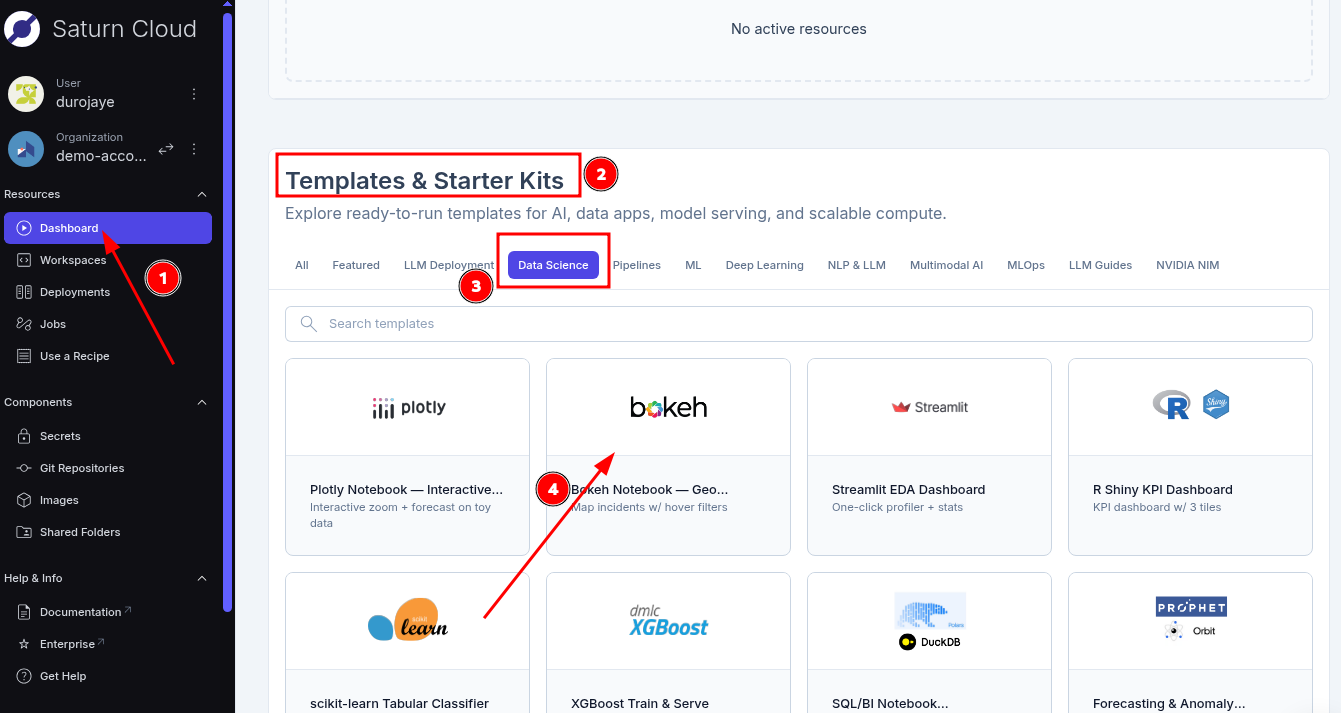
- Click on the dashboard in the top-left sidebar.
- Scroll down to the Templates & Starter Kits section
- Select the DataScience category
- Click on bokeh notebook
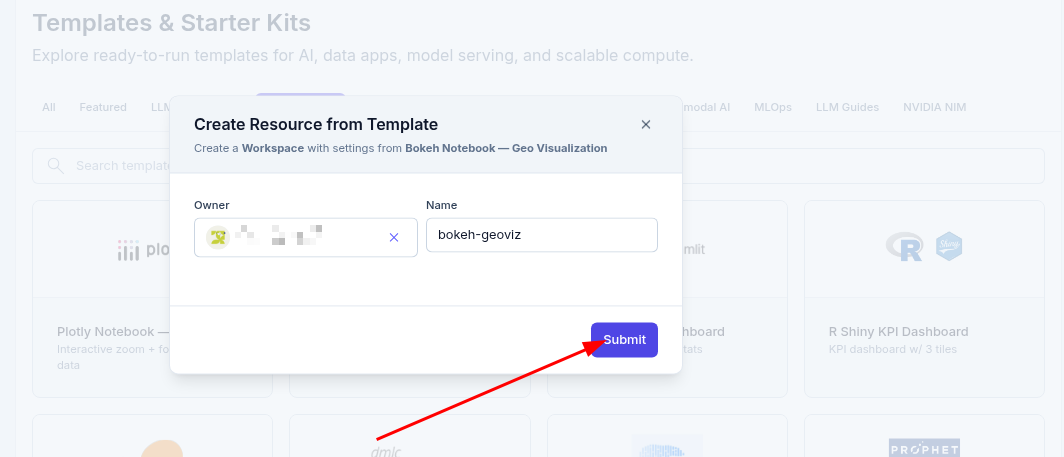
- In the Create Resource from Template modal, click Submit.
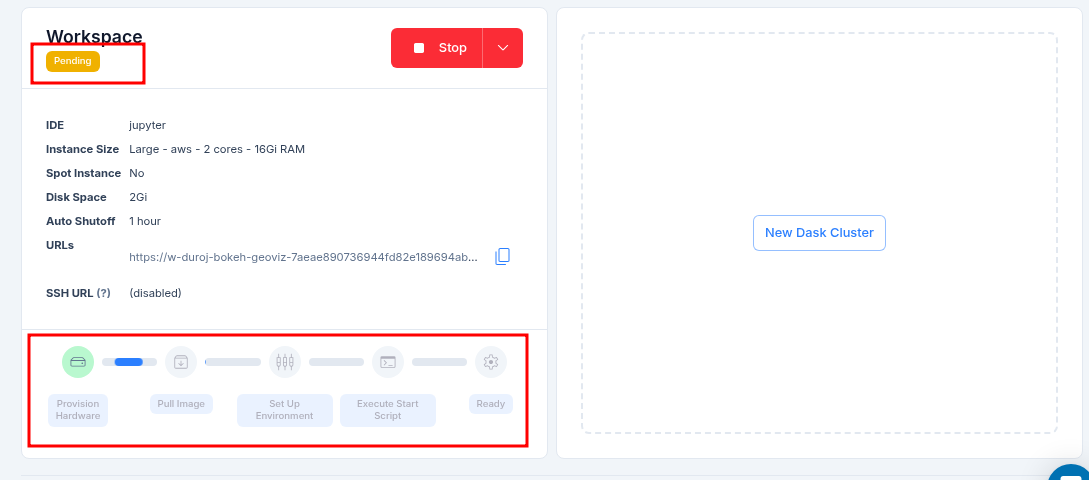
- After clicking on the Submit button, you will be taken to the Workspace page where all the configuration about the resource is located. Under the overview tab, click on the Start button to start the template.
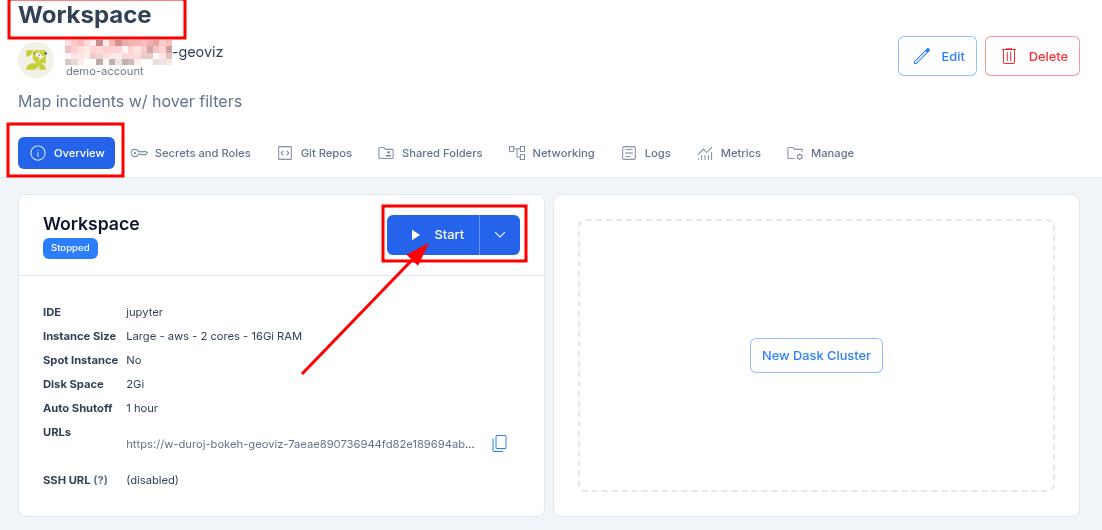
- The resource takes a few minutes to start and provision all the necessary software. The software bar will gradually fill up at the bottom of the resource information box.
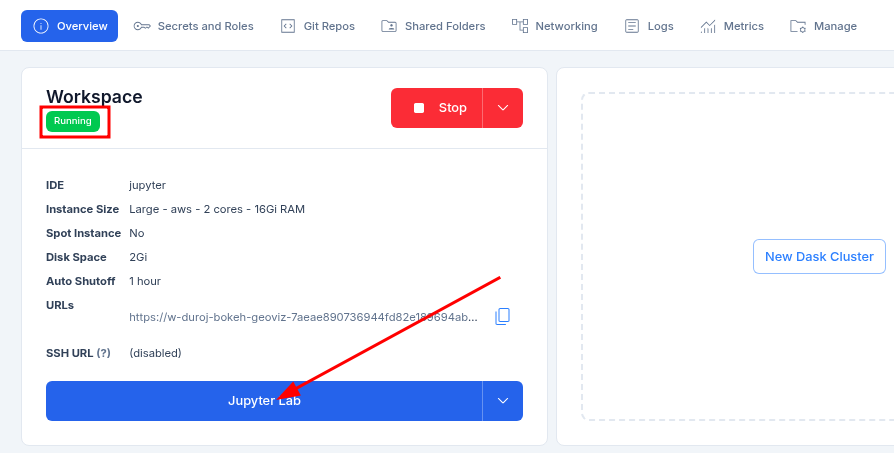
- Once the template resource is running, you can click on the JupyterLab tab to open the notebook and begin your analysis.
Note: A new tab will open with the notebook, as seen in the image below.
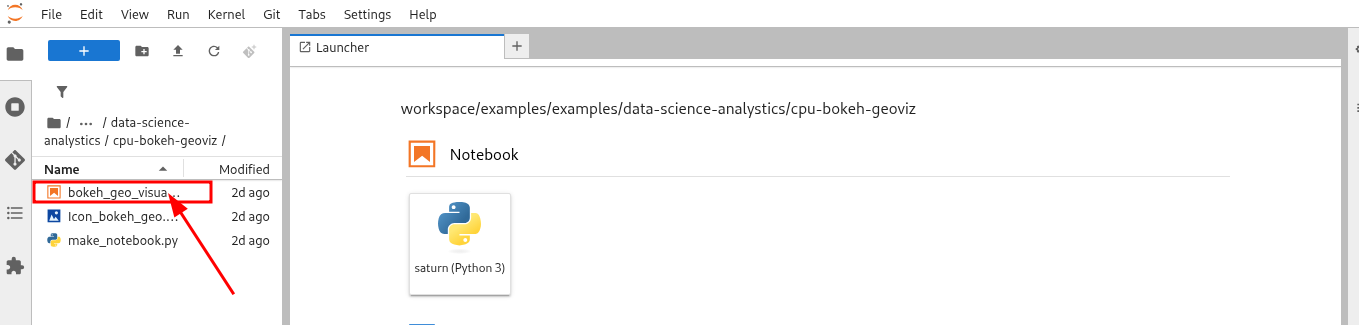
- In JupyterLab, double-click the notebook file in the left sidebar to open it. Then, press Run All in the top menu to execute the code and view the interactive map.
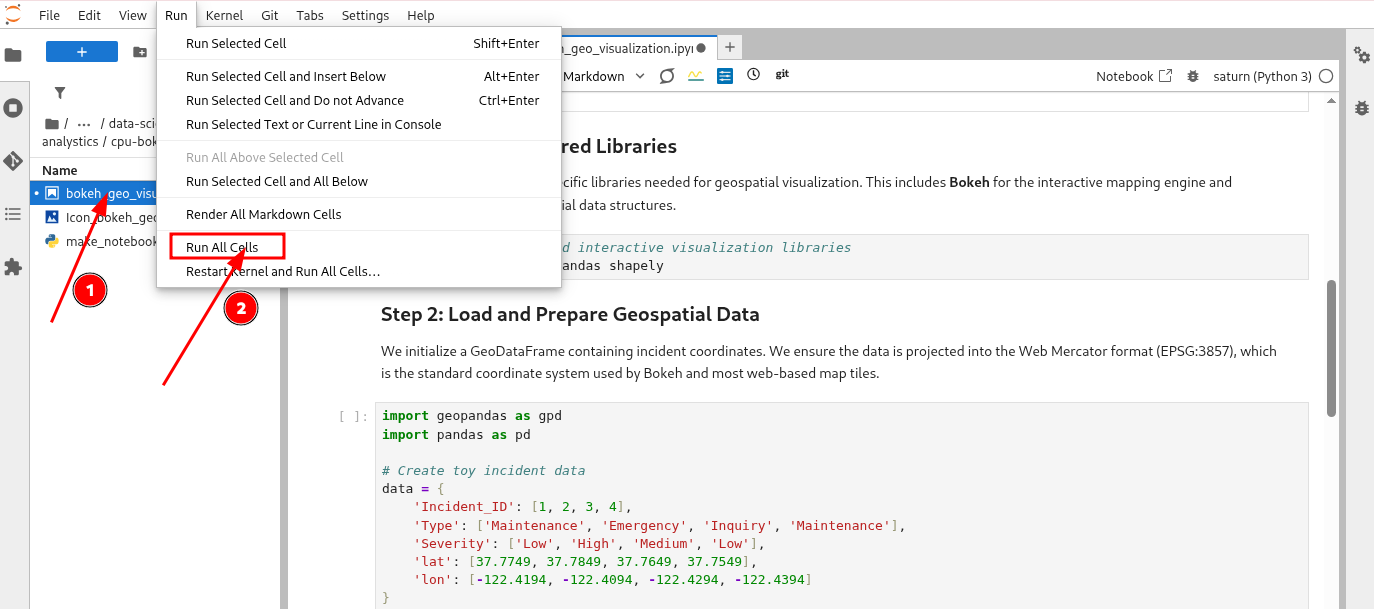
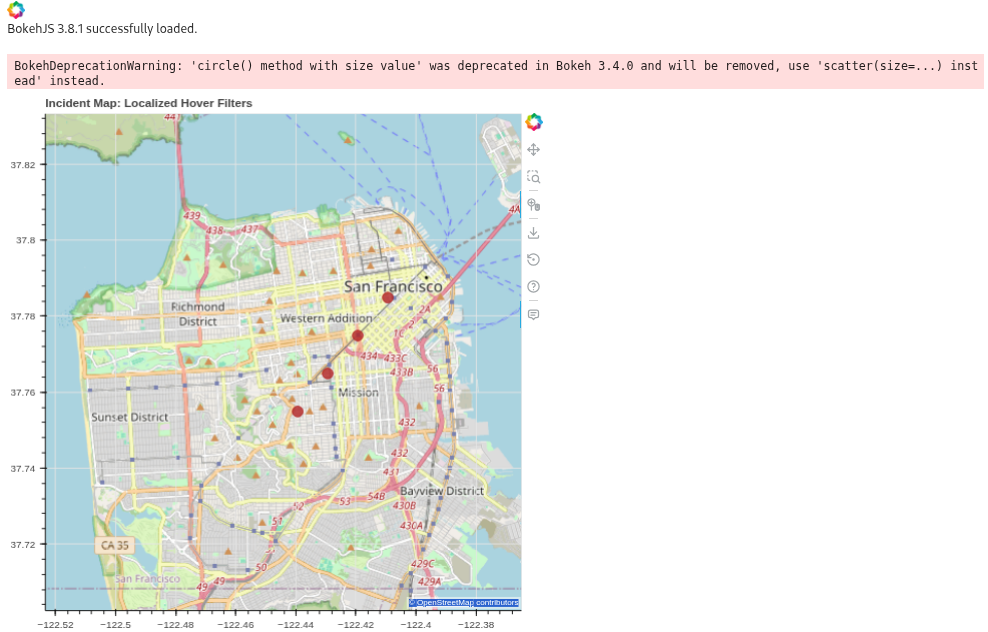
- Once the execution completes, the interactive Bokeh map will render directly in the notebook for you to explore.
What to Expect in the Notebook
The included notebook is self-contained and guides you through a complete geospatial workflow:
- Dependency Management: Installing specialized libraries (
bokeh,geopandas,shapely) into your active environment. - Data Ingestion & Preparation: Initializing a GeoDataFrame and projecting coordinates into the Web Mercator (EPSG:3857) format required for web-based tiles.
- Data Cleaning: Managing spatial columns to avoid serialization errors during rendering.
- Interactive Rendering: Building a Bokeh figure with OpenStreetMap background tiles and custom HoverTool configurations.
Troubleshooting & Best Practices
Serialization Errors: If you encounter a
SerializationError, ensure you have dropped or converted thegeometrycolumn before passing the DataFrame to a BokehColumnDataSource.Map Projection: Bokeh maps require coordinates in Web Mercator meters. Always use
gdf.to_crs("EPSG:3857")for your spatial data if using standard tile providers like OSM.Deprecation Warnings: You may see a warning about
circle()being deprecated. For future-proofing, you can usep.scatter(size=...)instead.
Key Features
- Interactive Hover Filters: Inspect localized data points dynamically with custom tooltips.
- High Performance: Optimized to handle coordinate transformations and rendering on standard CPU resources.
- Standard Tech Stack: Built with Python, GeoPandas for spatial logic, and Bokeh for web-ready interactivity.
- Ready for Production: A benchmark for spatial joins and coordinate system management.
Conclusion
This template demonstrates how to quickly build interactive geospatial visualizations on Saturn Cloud. By leveraging the power of GeoPandas and Bokeh, you can transform raw coordinates into insightful, interactive maps that are ready for deeper analysis or stakeholder presentations.
Resources and Support
- Platform: Saturn Cloud Dashboard
- Support: Saturn Cloud Documentation
- Library: Bokeh Documentation
- Library: GeoPandas Documentation