This article was published when data science tooling like Dask and R was a primary focus for Saturn Cloud. Today, Saturn Cloud is the enterprise AI platform for any GPU infrastructure.
Introduction
Plotly is a data visualization library for creating interactive, web-based graphs and charts. It supports a wide variety of chart types: line graphs, scatter plots, bar charts, pie charts, and more. Plotly allows you to easily customize your visualizations. Plotly also allows for real-time updates to the data and provides the ability to zoom, pan, and hover over the data points for deeper analysis.
Some of the key advantage of using Plotly over conventional visualization tools like matplotlib and seaborn are:
Interactivity: Plotly allows for interactive charts and graphs, making it easy to explore and analyze data.
Cross-platform compatibility: Plotly can be used with a variety of programming languages, including Python, R, and JavaScript, making it a versatile tool for data visualization.
Wide variety of chart types: Plotly supports a variety of chart types, including line graphs, scatter plots, bar charts, pie charts, and more.
Customization: Plotly provides various options for customizing charts, such as colors, styles, and annotations.
Real-time updates: Plotly supports real-time updates to data, making it ideal for dynamic data scenarios.
Free and paid versions: Plotly has both a free community edition and a paid professional edition, making it accessible to both individual users and businesses
In this article, you’ll learn how to deploy Plotly on a private server.
Building the application
In order to deploy a Plotly application, we need to build it. For demo purposes, we will build a simple application that allows users to choose a color from a dropdown. The color of the UI elements then changes to reflect the choice made by the user. The final dashboard then should look something like the image below:
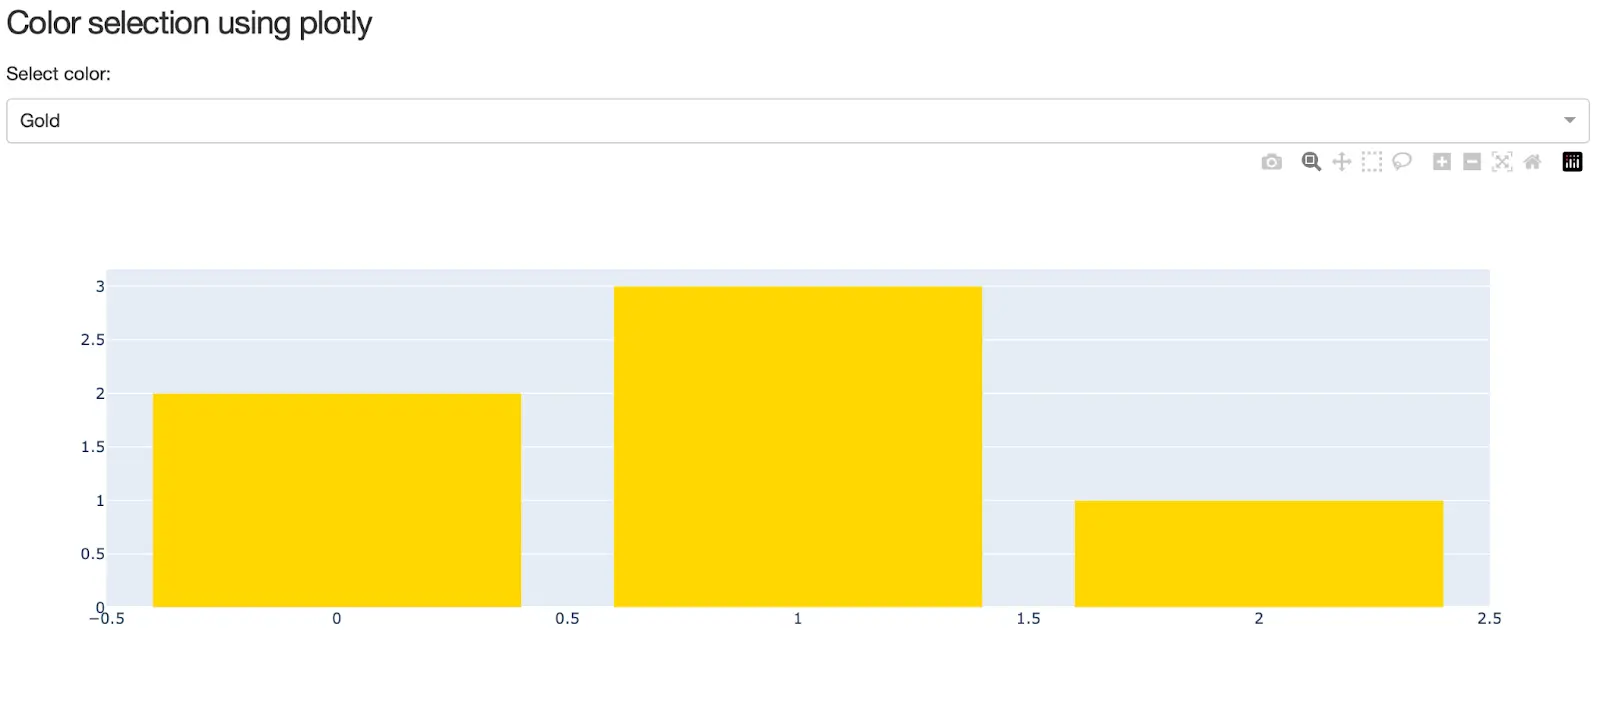
To build the application, follow the following steps:
Note: If you want the code, please find all codes in this public github repository.
Install the Plotly using the command: pip install plotly dash. This should install the library with all its dependencies.
Create a new file, app.py, with the following contents
import os

import plotly.graph_objects as go
from dash import Dash, Input, Output, dcc, html

external_stylesheets = ["https://codepen.io/chriddyp/pen/bWLwgP.css"]

app = Dash(__name__, external_stylesheets=external_stylesheets)

server = app.server

app.layout = html.Div(
    [
        html.H2("Hello World"),
        dcc.Dropdown(["LA", "NYC", "MTL"], "LA", id="dropdown"),
        html.Div(id="display-value"),
    ]
)


@app.callback(
    Output("display-value", "children"), [Input("dropdown", "value")]
)
def display_value(value):
    return f"You have selected {value}"


app.layout = html.Div(
    [
        html.H4("Color selection using plotly"),
        html.P("Select color:"),
        dcc.Dropdown(
            id="dropdown",
            options=["Gold", "MediumTurquoise", "LightGreen"],
            value="Gold",
            clearable=False,
        ),
        dcc.Graph(id="graph"),
    ]
)


@app.callback(Output("graph", "figure"), Input("dropdown", "value"))
def display_color(color):
    fig = go.Figure(
        data=go.Bar(
            y=[2, 3, 1],  # replace with your own data source
            marker_color=color,
        )
    )
    return fig


if __name__ == "__main__":
    app.run_server(debug=True)
Freeze all the requirements using
pip freeze > requirements.txtRun the application locally using
python app.py. After running this command, you should get the output as shown in the image above whenever you visit http://127.0.0.1:8050/. If you see any error messages, please ignore them.
The above steps are necessary to make sure that the application works locally. This prevents local errors from propagating to the server and allows you to focus on deployment. It is best to run the above commands while you are inside a virtual environment.
Deploying Plotly to a private server
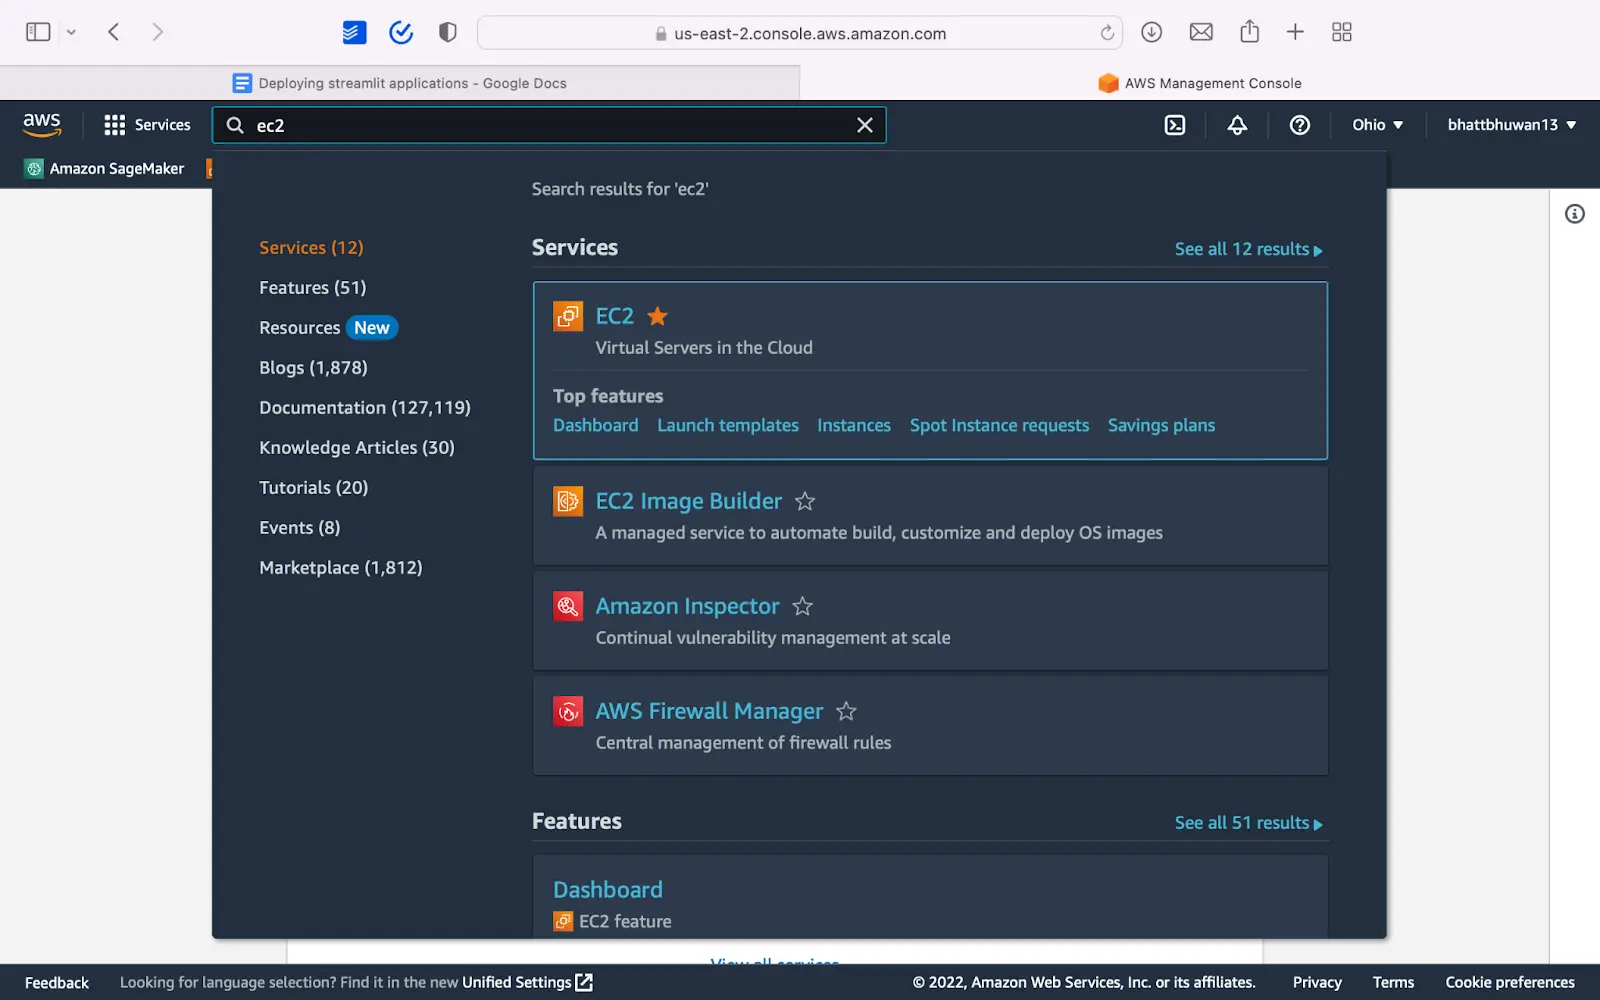
Now that the API is running locally, we can deploy it to production. For the same, you will need to launch an ec2 instance on aws and then deploy the application on top of it.
To launch an EC2 instance, follow the following steps:
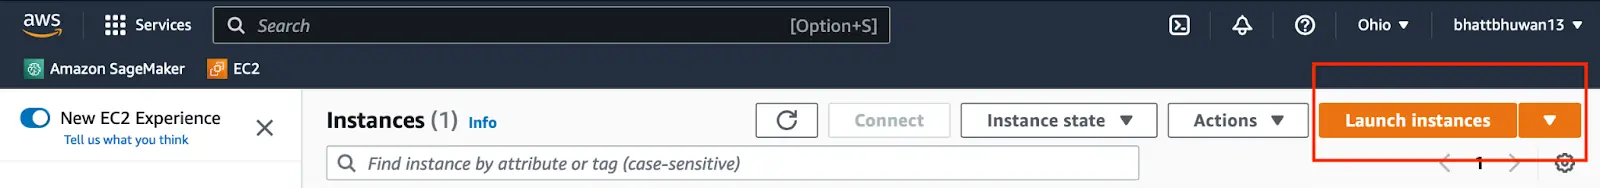
- login to aws, find EC2 among the services and click to open it.
- Click on the Launch Instance button:
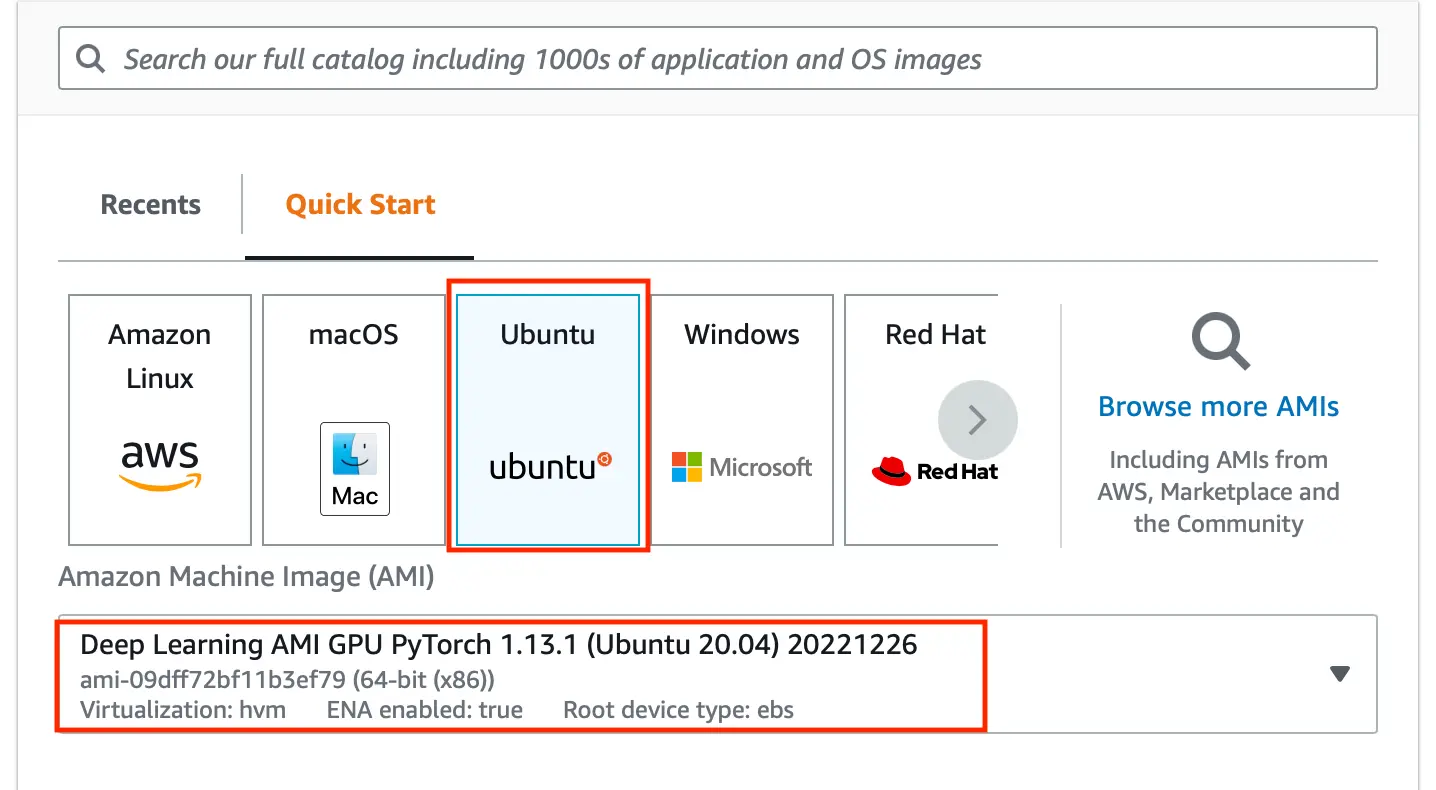
- You are free to use any instance and OS type, but for the sake of convenience, choose an Ubuntu instance and for the AMI choose deep learning ami. This comes with docker pre installed and saves us time and effort in later steps.
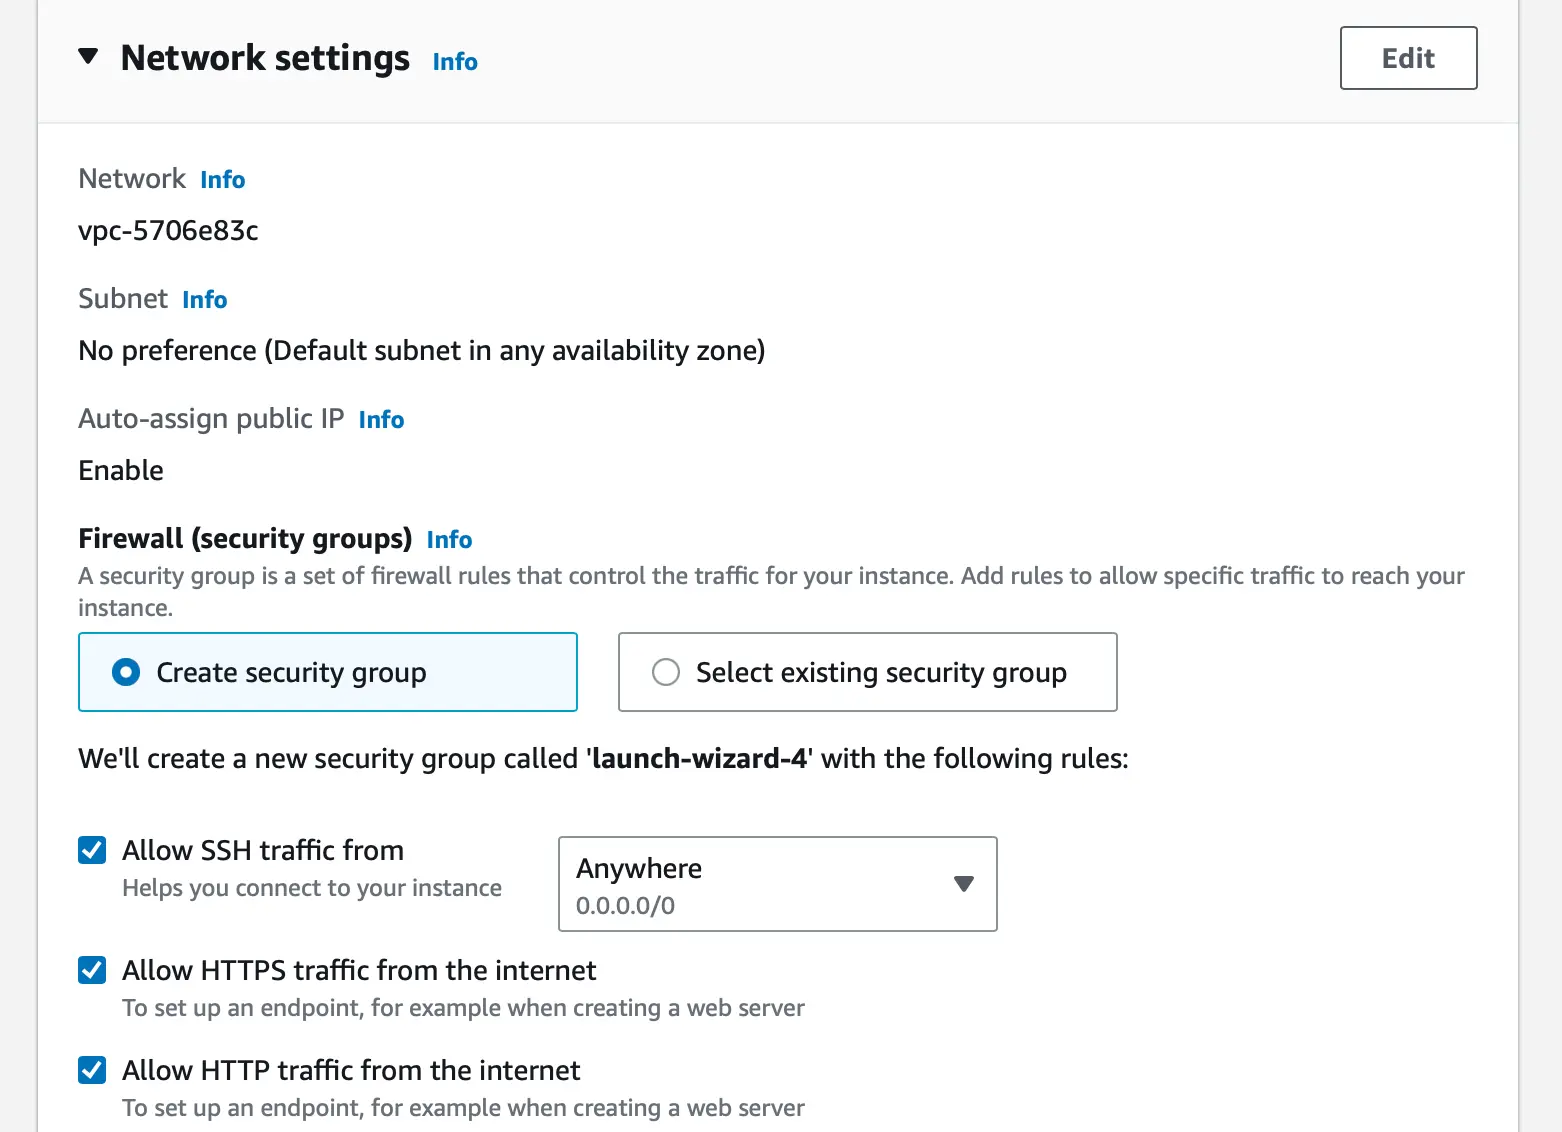
- This is important. No matter which cloud service you use, please allow connection on port 80 and 443(optional). On AWS EC2, you can do this by checking on allow HTTP and HTTPS traffic under the Network Settings. See the image below for reference.
Now that you have a server ready, you can deploy the application.
To deploy the application, follow the following steps,
- Create a virtual environment and install all the dependencies in the requirements.txt file created earlier. To install the dependencies, use the following command:
pip install -r requirements.txt
Install nginx. In an ubuntu based instance, you can do so by using the command
"sudo apt install nginx"Configure nginx by creating a new file,
‘fastapi_nginxin the/etc/nginx/sites-enabled/directory. The file should contain the following contents:
    server {
	    listen 80;
		server_name 52.15.39.198;
		location / {
		proxy_pass http://127.0.0.1:8050;
		}
	}
In the above configuration, please replace 52.15.39.198 with the public ip of your server. Also, note that the application is deployed on port 8050 locally
Restart nginx:
sudo service nginx restartFinally, in the directory containing main.py with the virtual environment activated, run the api using the following command:
python3 app.py &
Finally, you can visit the public URL of your server to see the deployed dashboard. For this particular task, the public ip is 52.15.39.198.
One of the major advantages of using nginx to deploy the application is that Nginx is able to handle a large number of concurrent connections and supports features like load balancing and SSL termination.
Conclusion
In this article, you learned to build and deploy Plotly dashboard on a private server. The same steps can be followed to deploy any Python based web application or the API.
Additional Resources: