With the rise in popularity of AI systems, data science plays an integral role in shaping these systems. One popular way to get started in data science is through the Python programming language, as there are many Python libraries designed to get you started. Pandas is one of those libraries. In this article, we will be learning how to use the Pandas library to manipulate data.
What is Pandas?
Pandas is a Python library for data analysis and manipulation. It provides powerful data analysis tools and data structures for handling complex and large-scale datasets. The primary data structures provided by pandas are:
- Pandas DataFrame
- Pandas Series
Installing Pandas
To install pandas first, we need to ensure Python is installed on your machine as pandas is cross platform agnostics
Using Conda
Optional: You can install pandas in your base environment or you can create a virtual environment with the command below.
    $ conda create -n my-env
    $ conda activate my-env
Install pandas
$ conda install pandas
Using PyPI
Run the command below to install pandas via pypi
$ pip install pandas
Pandas example
To get started with pandas in Python, we will need an IDE to write our code such as JupyterHub, Jupyter Notebook, Visual Studio Code, Replit, PyCharm, etc.
Before we go ahead, I have created a sample data that we will be manipulating. The data is available here to download. After downloading the file, upload it to your workspace.
Create a .py file (pandas_sample.py) and paste this code below.
    import pandas as pd

    # Load the CSV file into a DataFrame
    df = pd.read_csv("SampleData.csv")

    # Display the first 5 rows of the DataFrame
    print(df.head())

    # Select a specific column from the DataFrame
    print(df["Continent"])

    # Sort the DataFrame by a column in ascending order
    sorted_df = df.sort_values("Continent")
    print(sorted_df)
In the code above, we are using pandas to read the sample data file we uploaded. Pandas provides functions we can use in reading and manipulating data and we’ve used some of those functions to display selected data in the file and sort the data.
Run the file using python pandas_sample.py command and you should get the result below in your terminal.
        Continent  Frontend   Backend
    0         Africa         40       80
    1         Europe         80      120
    2           Asia        120       80
    3  North America        100       80
    4  South America        200      150
    0           Africa
    1           Europe
    2             Asia
    3    North America
    4    South America
    5        Australia
    Name: Continent, dtype: object
        Continent  Frontend   Backend
    0         Africa         40       80
    2           Asia        120       80
    5      Australia         18       50
    1         Europe         80      120
    3  North America        100       80
    4  South America        200      150
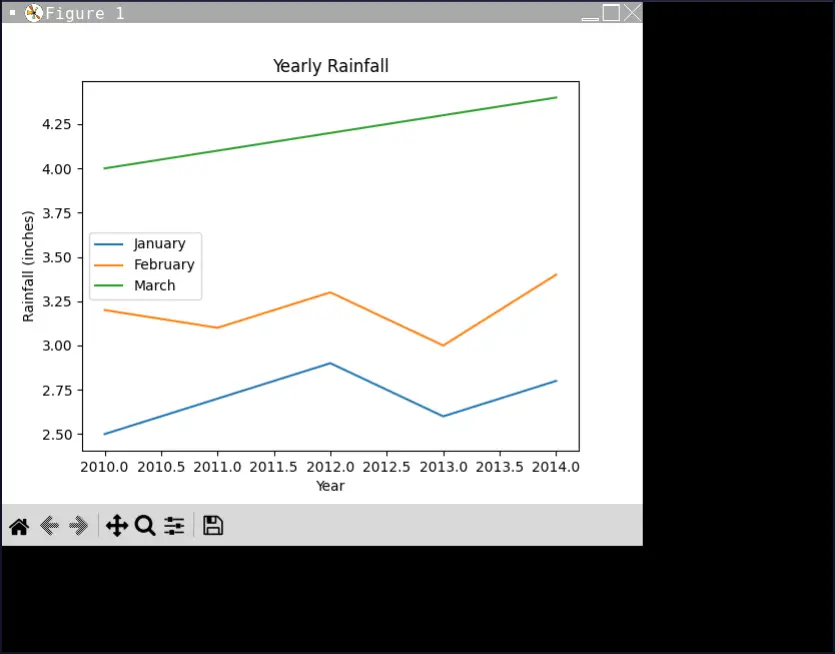
Another thing we can do with pandas is visualizing data with charts. This allows us to easier understand the data and the relationships between parts of the data. The example below illustrates this.
    import pandas as pd
    import matplotlib.pyplot as plt

    # Create a DataFrame with hypothetical rainfall data
    data = {'Year': [2010, 2011, 2012, 2013, 2014],
    'January': [2.5, 2.7, 2.9, 2.6, 2.8],
    'February': [3.2, 3.1, 3.3, 3.0, 3.4],
    'March': [4.0, 4.1, 4.2, 4.3, 4.4]}
    df = pd.DataFrame(data)

    # Set 'Year' as the index
    df.set_index('Year', inplace=True)

    # Plot the DataFrame
    df.plot()

    # Add a title and label the axes
    plt.title('Yearly Rainfall')
    plt.xlabel('Year')
    plt.ylabel('Rainfall (inches)')

    # Show the plot
    plt.show()
Pandas DataFrames
Pandas data frame is a two-dimensional data structure aligned in a tabular fashion (i.e. rows and columns). It is size mutable and potentially heterogeneous. The principal components of pandas dataframe are:
Rows
Columns
Data
There are several basic operations that can be performed in a pandas dataframe, such as:
Creating a dataframe
Indexing and selecting
Working with missing data
Creating with rows and columns
The example below shows how to perform the above basic operations in panda dataframes:
    import pandas as pd

    # Create a DataFrame
    data = {'continent': ['africa', 'europe', 'asia'],
    'frontend': [25, 50, None],
    'backend': [30, None, 50]}

    df = pd.DataFrame(data)

    # Select a specific column
    print(df['continent'])
    print('--------------------')

    # Select multiple columns
    print(df[['continent', 'backend']])
    print('--------------------')

    # Iterate over rows
    for index, row in df.iterrows():
    print(index, row['continent'], row['frontend'], row['backend'])
    print('--------------------')

    # Iterate over columns
    for column, values in df.items():
    print(column, values)
    print('--------------------')

    # Drop rows with missing data
    df = df.dropna()
    print(df)
The above should give the output below:
    0    africa
    1    europe
    2      asia
    Name: continent, dtype: object
    --------------------
    continent  backend
    0    africa     30.0
    1    europe      NaN
    2      asia     50.0
    --------------------
    0 africa 25.0 30.0
    1 europe 50.0 nan
    2 asia nan 50.0
    --------------------
    continent 0    africa
    1    europe
    2      asia
    Name: continent, dtype: object
    frontend 0    25.0
    1    50.0
    2     NaN
    Name: frontend, dtype: float64
    backend 0    30.0
    1     NaN
    2    50.0
    Name: backend, dtype: float64
    --------------------
    continent  frontend  backend
    0    africa      25.0     30.0
Pandas Series
Pandas series is a labeled one-dimensional array capable of holding any data (i.e. floats, strings, integers, python objects, etc.). Pandas Series is nothing but a column in an excel sheet.
Basic operations that can be performed in Pandas series are:
Creating a series
Binary operations on series
Accessing element of series
Conversion operation on series
Indexing and selecting data in series
The example below shows how to perform some of the above basic operations in Pandas series:
    import pandas as pd

    # Create a Series from a list
    s1 = pd.Series([1, 2, 3, 4, 5])
    s2 = pd.Series([2, 4, 6, 8, 10])
    print(s1)
    print(s2)
    print('--------------------')

    # Access an element using the [] operator
    print(s1[0])
    print('--------------------')

    # Perform binary operations using mathematical operators
    result = s1 + s2
    print(result)
    print('--------------------')

    # Perform binary operations using pandas methods
    result = s1.add(s2)
    print(result)
    print('--------------------')

    # Convert Series to list
    lst = s1.tolist()
    print(lst)
    print('--------------------')

    # Convert Series to DataFrame
    df = s2.to_frame()
    print(df)
The above should give the output below:
    0    1
    1    2
    2    3
    3    4
    4    5
    dtype: int64
    0     2
    1     4
    2     6
    3     8
    4    10
    dtype: int64
    --------------------
    1
    --------------------
    0     3
    1     6
    2     9
    3    12
    4    15
    dtype: int64
    --------------------
    0     3
    1     6
    2     9
    3    12
    4    15
    dtype: int64
    --------------------
    [1, 2, 3, 4, 5]
    --------------------
        0
    0   2
    1   4
    2   6
    3   8
    4  10
Additional Resources
To learn more about Python Pandas, check the links below: