
This article was published when data science tooling like Dask and R was a primary focus for Saturn Cloud. Today, Saturn Cloud is the enterprise AI platform for any GPU infrastructure.
As a data scientist or software engineer, you may often need to visualize the distribution of your data. One way to achieve this is by plotting the Cumulative Distribution Function (CDF) of a Pandas Series. In this tutorial, we will walk through the steps to plot a CDF of a Pandas Series in Python.
Table of Contents
- Introduction
- What is a Cumulative Distribution Function (CDF)?
- Prerequisites
- Pros and Cons of Python CDF Visualization for Data Exploration
- Error Handling
- Conclusion
What is a Cumulative Distribution Function (CDF)?
A Cumulative Distribution Function (CDF) is a function that shows the cumulative proportion of the data that falls below a certain value. In other words, it is the probability that a random variable takes on a value less than or equal to a given value. CDFs can be used to visualize the distribution of a dataset and are often used in statistical analysis.
Prerequisites
Before we begin, we need to make sure that you have the following libraries installed:
- Pandas
- Matplotlib
You can install these libraries by running the following command in your terminal:
pip install pandas matplotlib
Step 1: Load the Data
First, we will load the data that we want to plot the CDF for. For this tutorial, we will use the “tips” dataset from the Seaborn library. You can load the data using the following code:
import seaborn as sns

tips = sns.load_dataset("tips")
Step 2: Create a Pandas Series
Next, we will create a Pandas Series from the data that we want to plot the CDF for. In this example, we will use the “total_bill” column from the “tips” dataset. You can create a Pandas Series using the following code:
total_bill = tips["total_bill"]
Step 3: Calculate the CDF
Now that we have our Pandas Series, we can calculate the CDF using the following code:
import numpy as np

# Calculate the cumulative proportion of the data that falls below each value
cumulative = np.linspace(0, 1, len(total_bill))

# Sort the data in ascending order
sorted_data = np.sort(total_bill)

# Calculate the cumulative proportion of the sorted data
cumulative_data = np.cumsum(sorted_data) / np.sum(sorted_data)
In the above code, we first create an array of evenly spaced values between 0 and 1 with the same length as our Pandas Series. We then sort the data in ascending order and calculate the cumulative proportion of the sorted data.
Step 4: Plot the CDF
Finally, we can plot the CDF using the Matplotlib library. You can use the following code to plot the CDF:
import matplotlib.pyplot as plt

# Plot the CDF
plt.plot(sorted_data, cumulative_data)

# Add labels and title
plt.xlabel("Total Bill")
plt.ylabel("Cumulative Proportion")
plt.title("Cumulative Distribution Function (CDF) of Total Bill")
plt.show()
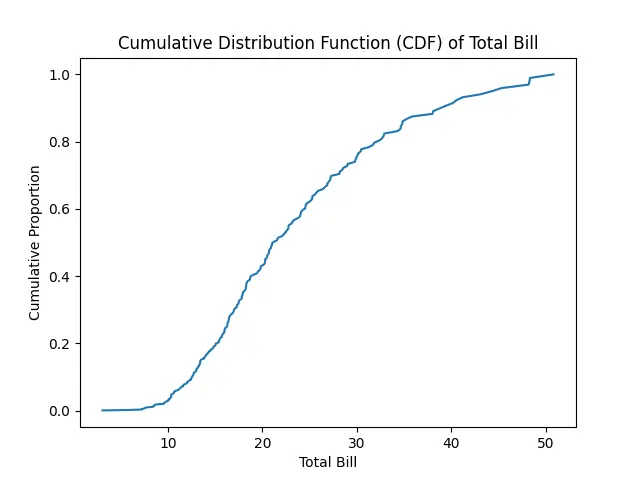
In the above code, we first plot the sorted data on the x-axis and the cumulative proportion of the sorted data on the y-axis. We then add labels and a title to the plot.
Pros and Cons of Python CDF Visualization for Data Exploration
Pros
Statistical Insight: CDFs provide a clear and intuitive way to understand the distribution of data, offering insights into how values are spread across different levels.
Comparative Analysis: CDFs allow for easy comparison between different datasets or variations within the same dataset, making it a valuable tool for data scientists and analysts.
Probability Representation: CDFs directly represent the probability that a random variable takes on a value less than or equal to a given point, aiding in probability analysis and decision-making.
Visual Appeal: The visual representation of CDFs is often more interpretable than other statistical measures, especially for non-technical stakeholders.
Cons:
Limited to Numeric Data: CDFs are most effective when dealing with numeric data, and their applicability may be limited in scenarios where other types of data need to be visualized.
Interpretation Complexity: While visually intuitive, interpreting the exact meaning of points on the CDF plot might be challenging for individuals without a statistical background.
Sensitivity to Outliers: Extreme values in the dataset can heavily influence the shape of the CDF, potentially distorting the overall perception of the data distribution.
Error Handling:
- Numeric Data Requirement Check: Handling: Include a check to verify that the selected column contains numeric data before proceeding with CDF calculations, providing guidance if non-numeric data is detected.
Conclusion
In this tutorial, we have learned how to plot a Cumulative Distribution Function (CDF) of a Pandas Series in Python. We first loaded the data, created a Pandas Series, calculated the CDF, and finally plotted the CDF using the Matplotlib library. CDFs are a useful tool for visualizing the distribution of a dataset and can be used in statistical analysis.
