
This article was published when data science tooling like Dask and R was a primary focus for Saturn Cloud. Today, Saturn Cloud is the enterprise AI platform for any GPU infrastructure.
How to Conduct Multivariate Regression in Excel?
As a data scientist or software engineer, you’re likely familiar with the concept of regression analysis. It is an important statistical tool used for predicting the relationship between a dependent variable and one or more independent variables. Multivariate regression analysis, as the name suggests, involves multiple independent variables.
In this blog post, we’ll explore how to conduct multivariate regression analysis in Excel, a tool that most of us are familiar with. Excel can be a powerful tool for conducting this type of analysis, and we’ll walk through the steps you need to take to conduct your own multivariate regression analysis.
What is Multivariate Regression?
Multivariate regression analysis is a statistical technique commonly used in social sciences, economics, and other fields where multiple independent variables are used to predict a single dependent variable. It is an extension of simple linear regression, which involves only one independent variable.
Multivariate regression analysis works by taking into account the relationships between several independent variables and a single dependent variable. The goal of the analysis is to determine the extent to which each independent variable contributes to the dependent variable, and whether there are any significant interactions between the independent variables.
How to Conduct Multivariate Regression in Excel?
Excel is a powerful tool for conducting multivariate regression analysis. However, before we dive into the steps of conducting the analysis, it is important to note that Excel has a limit of 16 independent variables for regression analysis. If you have more than 16 independent variables, you will need to use a different tool.
Now, let’s walk through the steps of conducting multivariate regression in Excel:
Step 1: Organize Your Data
Before you can conduct multivariate regression analysis, you need to organize your data. Your data should include a dependent variable and one or more independent variables. Each row of your data should represent a unique observation or case.
Step 2: Open the Data Analysis Tool
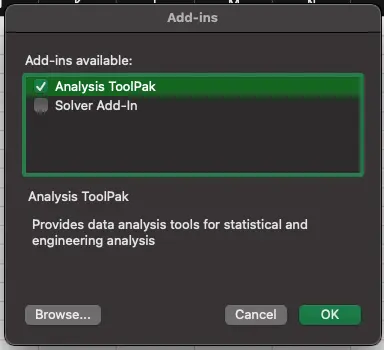
Excel has a built-in data analysis tool that you can use to conduct multivariate regression analysis. To access this tool, you first need to enable it. To do this, go to the “Tools” menu, select “Excel Add-ins” and Check the “Analysis ToolPak” box and click “OK.”
Step 3: Select the “Regression” Option
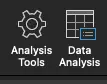
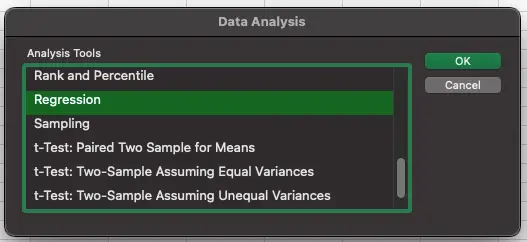
With the data analysis tool enabled, select the “Data” tab, and then select “Data Analysis” from the “Analysis” group. Select “Regression” from the list of analysis tools and click “OK.”
Step 4: Choose Your Input Range
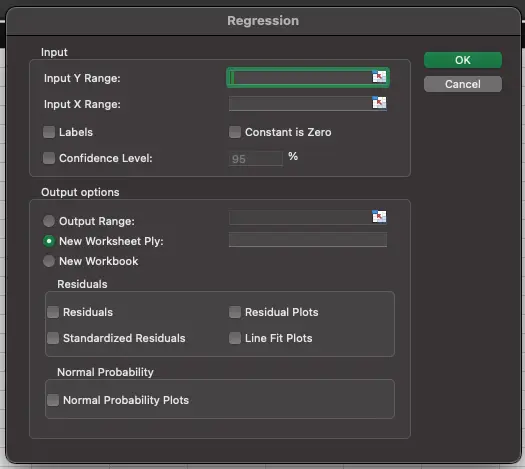
In the Regression dialog box, select the dependent variable and the independent variables. Make sure to choose your input range carefully, as this will determine the variables that are used in the analysis.
Step 5: Choose Your Output Range
Next, choose where you want the output of the analysis to be displayed. This can be in a new worksheet or in a specific range on an existing worksheet.
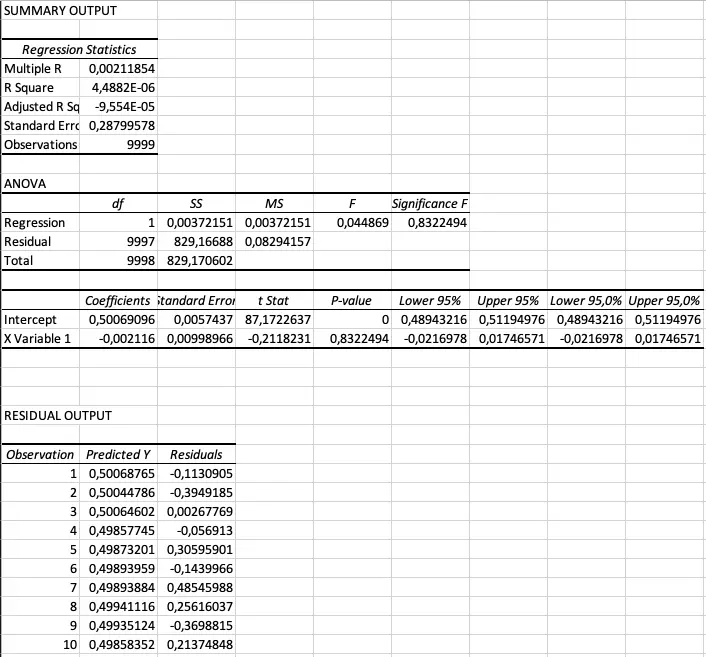
Step 6: Check the “Residuals” Box
In the Regression dialog box, make sure to check the “Residuals” box. This will allow you to see how well the model fits the data.
Step 7: Interpret the Results
Once you have conducted the analysis, you can interpret the results. The output will include a summary of the model, including the coefficient values for each independent variable, the standard error, t-value, and p-value. You can use these values to determine the significance of each independent variable.
Conclusion
Multivariate regression analysis is a powerful statistical tool used for predicting the relationship between a dependent variable and multiple independent variables. Excel is a powerful tool for conducting this analysis, as long as you have 16 or fewer independent variables. By following the steps outlined in this blog post, you can conduct your own multivariate regression analysis in Excel and interpret the results to gain valuable insights into your data.
