
Introduction
Machine translation has enormous potential to promote cross-cultural communication. Over the past 70 years, the quality of machine translation has evolved, culminating in systems currently powered by Neural Machine Translation. Improvements to these systems are rooted in the evaluation of system strengths and weaknesses. However, the complexity of language makes it difficult to create rules that separate high- and low-level language.
A native speaker can naturally evaluate language quality. However, human evaluation of text is slow, expensive and difficult to reproduce. By comparison, automatic metrics are faster, cheaper, accessible, scalable, reproducible and facilitate objective comparison between machine translation (MT) systems. These metrics assess the quality of system output by measuring the similarity, or distance, between a human-produced reference and the machine-generated translation. The smaller the distance, the more the translation resembles a high-quality, human-like translation.
Measuring how automatic evaluation metrics perform when compared to human ratings has facilitated their transformation from traditional rule-based metrics to more advanced neural-based metrics. Each metric’s quality is determined by its correlation with human judgment. Below, we discuss the most popular metrics in the field today.
String Metrics
Position Dependent
Levenshtein Distance is the most basic measure, in that it quantifies the work required to convert machine-generated output into the reference translation. Each substitution, insertion and deletion is one operation. These operations are summed and divided by the number of words in the reference. When fewer operations are needed to move from machine-generated output to the human-produced reference, the system will generate a lower score, indicating a higher degree of similarity between the output and the reference.
Implementation: https://pypi.org/project/fuzzywuzzy/
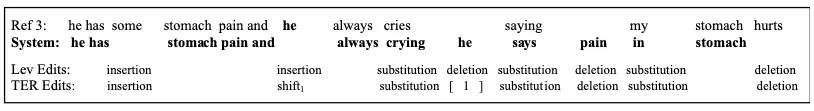
TER, or the Translation Error Rate, is defined in much the same way as the Levenshtein Distance calculation. However, this metric is able to account for differences in word order and is therefore less dependent on position than Levenshtein distance. It does this by recognizing shifts or sequences of words. The metric does not penalize for this shift, thereby accounting for output that includes words seen in the reference, but in a different order. The example below would score the output with a 7/13 by the TER metric, but with an 8/13 when applying the Levenshtein distance algorithm.
https://www.researchgate.net/publication/228977302_Automated_metrics_for_speech_translation#pf4
Unlike most metrics, the Levenshtein Distance and TER will output 0 as a perfect score. In order to compare TER and Levenshtein to other metrics, each of their scores are subtracted from 1.
Implementation: https://github.com/mjpost/sacrebleu
N-Gram Metrics
Position Independent
BLEU is a precision-oriented metric that relies on n-gram overlap, matching 1-, 2-, 3- and 4-gram tokens. Although these matches are position-independent within the sentence, the word order of the n-gram itself must be preserved.
Precision tells us how much of the output was relevant or needed. It’s calculated as:

We can illustrate this idea with an example.
| Reference | Output |
|---|---|
| “What’s your name?” | “Name?” |
The precision here is 1, calculated as 1 match/1 word. The BLEU metric, however, would not return a score of 1, as it is not just calculating precision. The calculation additionally incorporates a brevity penalty, penalizing an output that is shorter than its reference. In sum, BLEU outputs the weighted geometric mean of all modified n-gram precisions, multiplied by the brevity penalty. It correlates poorly with human judgment, largely because the metric is unable to capture semantic meaning.
Implementation: https://github.com/mjpost/sacrebleu
ROUGE, or Recall-Oriented Understudy for Gisting Evaluation, is a set of n-gram overlap metrics. ROUGE-N complements BLEU in that it measures the number of matching n-grams between the machine-generated output and a human-produced reference, ultimately returning the average of n-grams matched between the two.
Contrary to BLEU, ROUGE is recall-oriented. Recall tells us how much of the reference is captured in the output. It’s calculated as:

Let’s revisit our last example.
| Reference | Output |
|---|---|
| “What’s your name?” | “Name?” |
The recall here would be ⅓, calculated as 1 match/3 words. The recall score is lower than the precision score because the output is missing words or information contained in the reference. Similar to BLEU, ROUGE correlates poorly with human judgment, as it measures syntactical rather than semantic matches.
Implementation: https://pypi.org/project/rouge/
chrF stands for character (n-gram) F-score. The metric calculates all character and word n-grams matches, averages these matches, and ultimately returns the F-score. As this metric considers text at the character level, the metric is tokenization-independent, and therefore:
Is highly reproducible as it requires no preprocessing
Is easier to apply to CJK (Chinene, Japanese, Korean) languages
Is more robust when scoring morphologically rich languages as the metric is able to recognize and match variations of words that share the correct root/stem
CHRF is the second most popular metric and is highly recommended, recently by MT researchers at Microsoft, because it has repeatedly been shown to correlate better than BLEU with human judgments of MT quality, especially on the sentence level.
Implementation: https://github.com/mjpost/sacrebleu
METEOR, or Metric for Evaluation of Translation with Explicit Ordering, improves on the BLEU metric by introducing more flexibility to the matching algorithm. By means of stemming and paraphrase tables, the metric can recognize synonyms, word stems, and even paraphrases as valid matches, which allows it to capture some degree of semantic similarity that may be shared by the output and the reference. The metric averages matches via the harmonic mean, and attributes greater weight to exact matches and less weight to stemmed matches. METEOR correlates better with human judgment than BLEU.
Implementation: https://www.cs.cmu.edu/~alavie/METEOR/
Neural Metrics
Contextualized Embeddings
BERTScore implements the idea on which string metrics are based, but additionally, encodes words using contextualized word embeddings constructed using the BERT language model. From these embeddings, the distance between each embedding is calculated using cosine similarity. While word matches can appear anywhere in the sentence, embedded tokens are matched one-to-one, in that each word in one sequence travels to the most semantically similar word in the other sequence. Intuitively, the metric assigns a perfect score to the output text if it conveys the same semantic meaning as the reference text. BERTScore was one of the first metrics to incorporate a large language model. It follows that this metric is one of the most widely adopted in the machine translation evaluation community.
Implementation: https://huggingface.co/spaces/evaluate-metric/bertscore
MoverScore finds the shortest path to conversion between the contextualized embeddings of machine generated output and its corresponding reference by solving a constrained optimization problem. The metric’s ability to capture shared semantic meaning is enhanced by fine-tuning contextualized word embeddings on Natural Language Inference datasets, ultimately returning the dissimilarity between the output and reference embeddings. MoverScore goes beyond BERTScore as it relies on soft alignments (many-to-one) and maps semantically related words in one sequence to the respective word or words in the other sequence.
Implementation: https://github.com/AIPHES/emnlp19-moverscore
Supervised Metrics
Learned Functions
Per the Google GitHub page, BLEURT indicates to what extent machine output is fluent and conveys the meaning of the reference. Like BERTScore, BLEURT relies on BERT’s contextual language embeddings. Unlike BERT, BLEURT goes through a few additional phases of training. The training process starts from a pre-trained BERT language model. Next,the “pre-training” phase incorporates synthetic text from Wikipedia, which is randomly perturbed to mimic variations in output. By exposing the metric to more varied data, BLEURT is more robust to quality and domain drifts. Finally, during a phase known as fine-tuning, the metric is trained using a supervised, learned function, employing human ratings of translations found in the WMT dataset as the target. In my experience, this metric performs best overall. However, in terms of computation, it’s extremely expensive.
Implementation: https://github.com/google-research/BLEURT
COMET also leverages a large language model, but often favors the XLM-RoBERTa language model over the BERT language model. Like BLEURT, this metric includes a second phase, during which the metric is further refined using human ratings. Unlike BLEURT, COMET does not incorporate synthetic data to training, simplifying this metric’s training process. Finally, COMET exploits the source sentence along with the output and reference sentences, which means its learned function is fine-tuned on a triple rather than a double sentence.
Implementation: https://github.com/Unbabel/COMET
Conclusion
Each metric has its own set of strengths and weaknesses. This indicates that these metrics are, to some degree, orthogonal. Understanding what each metric does, and does not do well, lends insight on why we get the scores we do. Metrics that follow simple formulas, such as BLEU and ROUGE, are highly explainable, but of low quality. On the other hand, it’s difficult to understand the inner workings of the highest quality metrics because they are built using neural networks (which tend to be black boxes, e.g. not explainable). Different approaches attempt to explain the advantages and disadvantages of neural-based metrics, a few of which are detailed below:
BLEURT, BERTScore and Moverscore have been shown to have problems correctly predicting the score for text containing antonyms and negations
BERTScore and MoverScore are best at capturing lexical similarity
Moverscore captures fluency better than BERTScore due to its ability to handle the jumbling of words
Researchers have hypothesized that a combination of these metrics may yield a considerably better metric. Combining metrics relying on similar factors shows less improvement, and even leads to worse results, while combining metrics relying on different factors can greatly improve their performance.
Sign up for Saturn Cloud today and start experimenting with combinations of these metrics to find what works best for your specific task.