Deploy Your Machine Learning Model - Part 3 (Flask API or Web App)

This post continues our series about deploying machine learning models with Saturn Cloud - if you missed it, read Part 1 here and Part 2 here.
Our Toolkit
- Saturn Cloud (so you can deploy easily!)
- Flask
- Plotly (python and JS)
- Scikit-learn (for our model)
Other Helpful Links
- codebook for the dataset
- plotly.js cheat sheet
- Jinja (helpful for Flask)
See it in Action!
If you have a Saturn Cloud account, you can see the Flask web application running live now, or see the Flask REST API.Since you created the model in Part 1 of this series, you have everything you need to produce a deployment. Read on to learn how!
Flask
To build a deployment in Flask, we’ll be using Python scripts instead of the Jupyter notebooks that Voila uses. As a result, there’s more flexibility and possibility available — especially if you start integrating additional frontend frameworks. For this project, we have two choices about how to proceed:
- A bare REST API
- A web app (displaying an interface like we made with Voila in Part 2)
If we choose the web app, we’ll be developing with Python, HTML, CSS, and some Javascript. That might sound like a lot, but it’s less complex than it might seem at first. In the case of the API, you can avoid a lot of the front-end design, but some is still advisable to help your user get the hang of things.
Application
As with Voila, we want to take the functions we wrote and put them into a script — instead of .ipynb, this will be just .py. The majority of our work can be contained in this Python script, which we’ll call app.py. This holds all our code described above and in Part 1, as well as some functions depending on what kind of endpoint we’re building. I’m going to add one extra function as well, which wraps up all the work we did and runs it together when called.
def run_workflow():
    df = load_data()
    X, y = split_data(df)

    modobj, modscore = trainmodel(X, y)
    return modobj, modscore, df
Now, inside our script, we initialize Flask, call our model function, and get everything set up.
app = Flask(__name__)
modobj, modscore, df = train_model()
Index
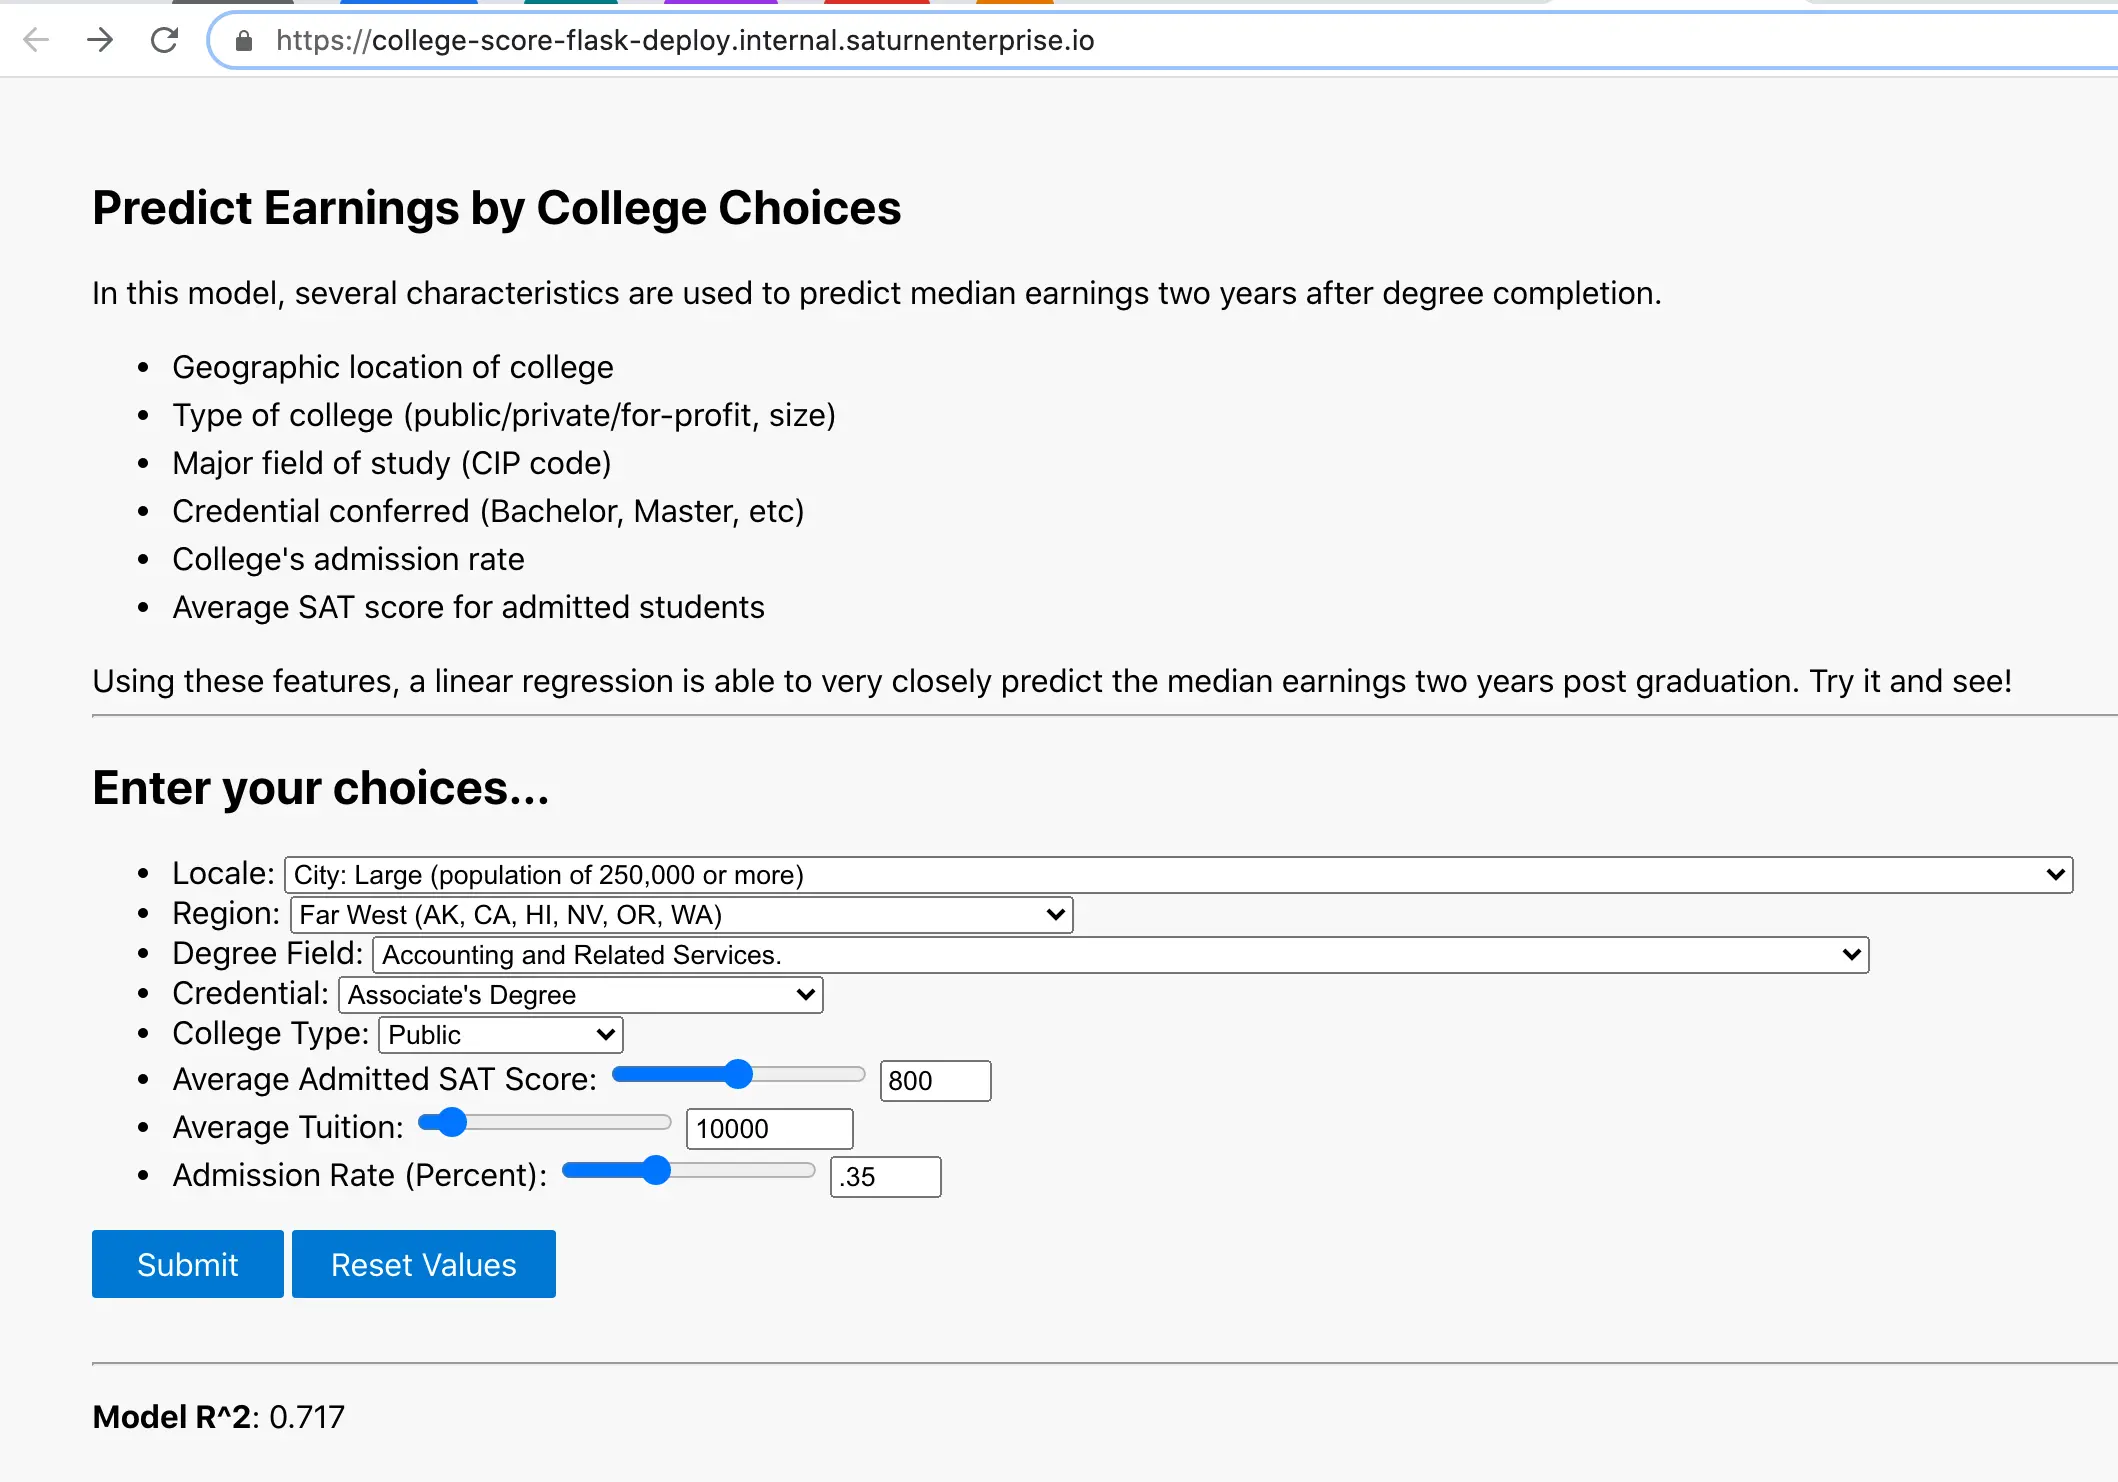
It’s probably nice for your users to create a landing page, whether they will be using your application in browser or not, just so there’s somewhere to get information and learn to use your tool. In the app.py script, we’ll have a function that creates this landing page.
In this function, called index, our Flask application is instructed to render the HTML- that’s pretty much all this function does. We also have a few pieces of data in there to help the renderer make our value selectors correctly. (Abbreviated list for space.) Notice this function has NO returns- that’s because its whole purpose is to make the HTML, and that’s all.
@app.route("/")
def index():
    # Main page
    return render_template('index.html',
    modscore = round(modscore,3),
...
    cred_list = creds,
    tuit_min = min(round(df['tuition'].astype(float), 1)),
    tuit_max = max(round(df['tuition'].astype(float), 1)),
    adm_min = min(df['ADM_RATE_ALL'].astype(float)),
    adm_max = max(df['ADM_RATE_ALL'].astype(float)))
So it’s generating some HTML — but how does it know what to do? We’ll make a design template, and then fill in just the content we need to show the user.
What does the HTML template need to look like? It can start with the most basic HTML page outline. Flask uses Jinja templating to populate variables and pass information around, so you’ll see a lot of items enclosed in double curly braces indicating Jinja variables. Also, note the section inside our body tags, because this is where any pages we make will populate the information they contain.
<!DOCTYPE html>

<html>
  <head>
    <meta charset="utf-8" />
    <title>Demo Model Deployment</title>
    <meta name="viewport" content="width=device-width, initial-scale=1" />
    <link rel="stylesheet" type="text/css" href="{{ url_for('static',filename='main.css') }}" />
    <script src="https://cdn.plot.ly/plotly-latest.min.js"></script>
  </head>

  <body>
    {% block content %}
	<! -- This is where our dynamic content will appear -->
    {% endblock %}
  </body>

  <footer>
    <h6>Courtesy of Saturn Cloud</h6>
    <script src="{{ url_for('static',filename='main.js') }}"></script>
  </footer>
</html>
The index HTML page, as a result of the template, doesn’t need to repeat the HTML wrappings at all. It can be as simple as some HTML description and the fields we are asking the user to select. It DOES however need to be wrapped in the following, so the templating system knows what to do.
{% extends "design.html" %} {% block content %}
	<! -- our index-specific HTML and form -->
{% endblock %}
Interactivity
If you want to make it possible for the user to submit options via the UI, then add a form and selectors to this page — if you just want people to submit options via URL arguments, you can skip this.
Almost everything you do in the index page then can be standard HTML. My selectors are enclosed in a form, and look like this. Notice that the credentials selector has several Jinja variables- how did these get here? From app.py!
<form action="/result">
  <div class="panel">
    <ul>
	 <li>Credential:
	      <select name='cred' method="GET" action="/">
	        {% for credtype in cred_list %}
	        <option value= "{{credtype}}" SELECTED>{{credtype}}</option>"
	        {% endfor %}
	      </select>
	 </li>
...
     </ul>
  </div>
  <div style="margin-bottom: 2rem;">
    <input type="submit" value="Submit" class="button"/>
    <input type="reset" value="Reset Values" class="button" />
  </div>
</form>
Add as many selectors as your work requires, and you’re good to go.
Results
Our next task is giving results back to the user. We can either return plain JSON as a REST API (easier to pass to other applications), or a UI version (easier to consume business users, for example). Whichever way we go, we need a function in app.py that will create the results from the inputs, however. This stub will do that for us. It loops over all our inputs, checks that they are present in the arguments on the URL, and then runs our prediction from the model.
@app.route('/result')
def result():

    variables = {'SAT_AVG_ALL':'sat',
                'CREDDESC':'cred',
                'CIPDESC_new':'cip',
                'CONTROL':'coltype',
                'REGION':'region',
                'tuition':'tuit',
                'LOCALE':'locale',
                'ADM_RATE_ALL':'adm',
        }
    for i in variables:
        if variables[i] in request.args:
            if variables[i]  == 'adm':
                variables[i] = request.args.get(variables[i], '', type= float)
            elif (variables[i] == 'tuit') | (variables[i] == 'sat'):
                variables[i] = request.args.get(variables[i], '', type= int)
            else:
                variables[i] = request.args.get(variables[i], '')
        else:
            return f"Error: No {variables[i]} field provided. Please specify {variables[i]}."

    newdf = pd.DataFrame([variables])

    [[prediction]] = modobj.predict(newdf)
    pred_final = prediction if prediction > 0 else np.nan
...
REST API
If we’re not making a UI endpoint, then we can add this to our result function to complete the script.
...
variables['predicted_earn'] = pred_final
    return jsonify(variables)
And that’s that! When users visit our webpage, they’ll get to submit options, or they can go directly to our URL and pass things programmatically. A JSON result will be returned. (You can customize the @app.route call to name it “api” or something similar that works for you.)
UI Endpoint
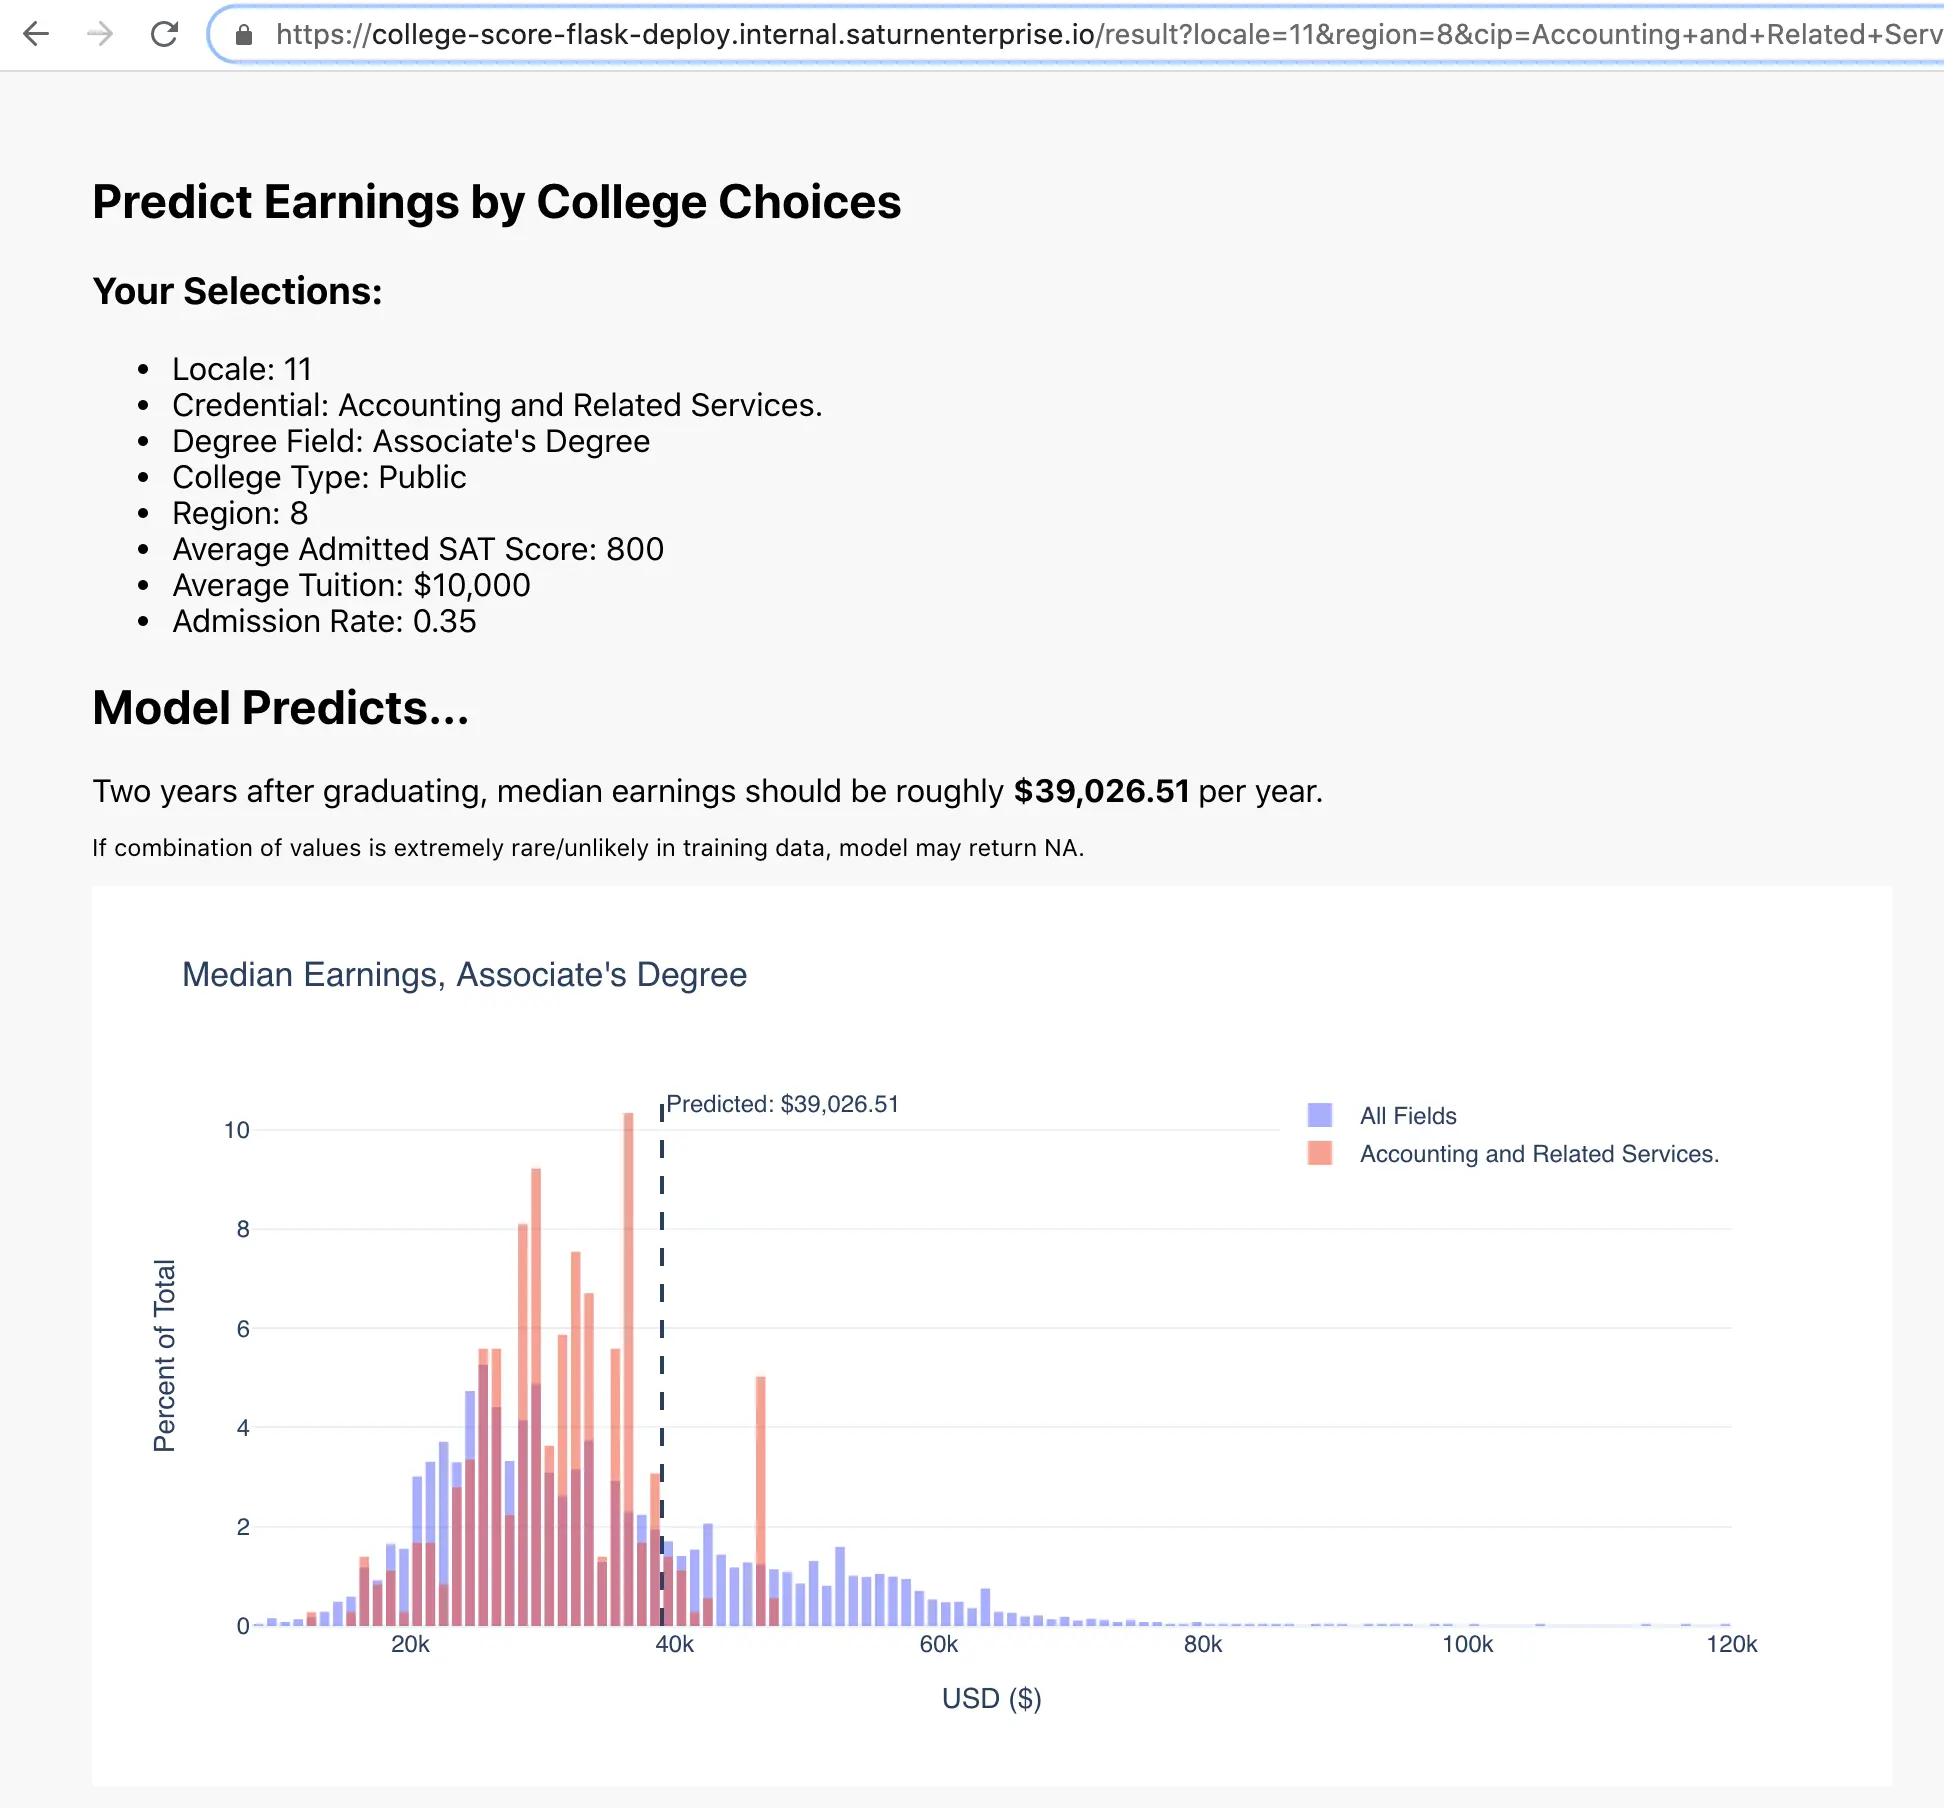
If we need to present our results more attractively, we can make the output into a result.html page. The template we already saw for index.html can work for this too, so the HTML required is minimal. For fun, I’ll also show you the plot rendering so we can replicate the Voila functionality fully.
First, this is the rest of the results function for app.py if we want to make a UI endpoint. It’s not much more- we just create our plot (same function as Voila), and run render_template like we did for index.html with some different arguments.
...
p3 = plotly_hist(df=df, degreetype = variables['CREDDESC'],
         prediction=pred_final, majorfield=variables['CIPDESC_new'])
    graphJSON = json.dumps(p3, cls=plotly.utils.PlotlyJSONEncoder)

    return render_template(
        'result.html',
        pred_final = round(pred_final, 2),
        graphJSON=graphJSON
   )
Our results.html code will receive all this stuff and display it for us. We can also pass all the model inputs if we want, and show them so the user sees all the values they provided - this is just optional.
For the rendering, then, all the results page really needs to have as far as HTML is this. It uses pred_final and graphJSON to print the prediction and also print the plot. We’re using a little Javascript to print the plot, of course, but if you’d rather not get into that you can easily leave it out.
{% extends "design.html" %} {% block content %}
<h2> Model Predicts... </h2>
Two years after graduating, median earnings should be roughly
<b> {{"${:,.2f}".format(pred_final)}} </b>per year.

<p style="font-size: 12px;"> If combination of values is
extremely rare/unlikely in training data, model may return NA.</p>

<div id="tester" style="width:900px;height:450px;"></div>

<script>
    TESTER = document.getElementById('tester');
    var GRAPH = {{ graphJSON | safe }}

    [Plotly](https://saturncloud.io/glossary/plotly).plot(TESTER, GRAPH, {} );
</script>
{% endblock %}
Deploy
Now we have two applications: API and web app. Deploying them is actually just the same! Inside our app.py script/s we’ll add one last bit (don’t forget the port and host!):
if __name__ == "__main__":
  app.run(host='0.0.0.0', port=8000)
This lets us use the command python app.py to run our application.

Our file structure will look something like this (minus results.html if we are just doing API.)
flask_app/
├── app.py
├── templates/
│   ├── design.html
│   └── index.html
│   └── results.html
That’s really all we require, although you can certainly add more CSS or Javascript files. Add all this to your Github repository that we discussed earlier — or make a new one if needed.
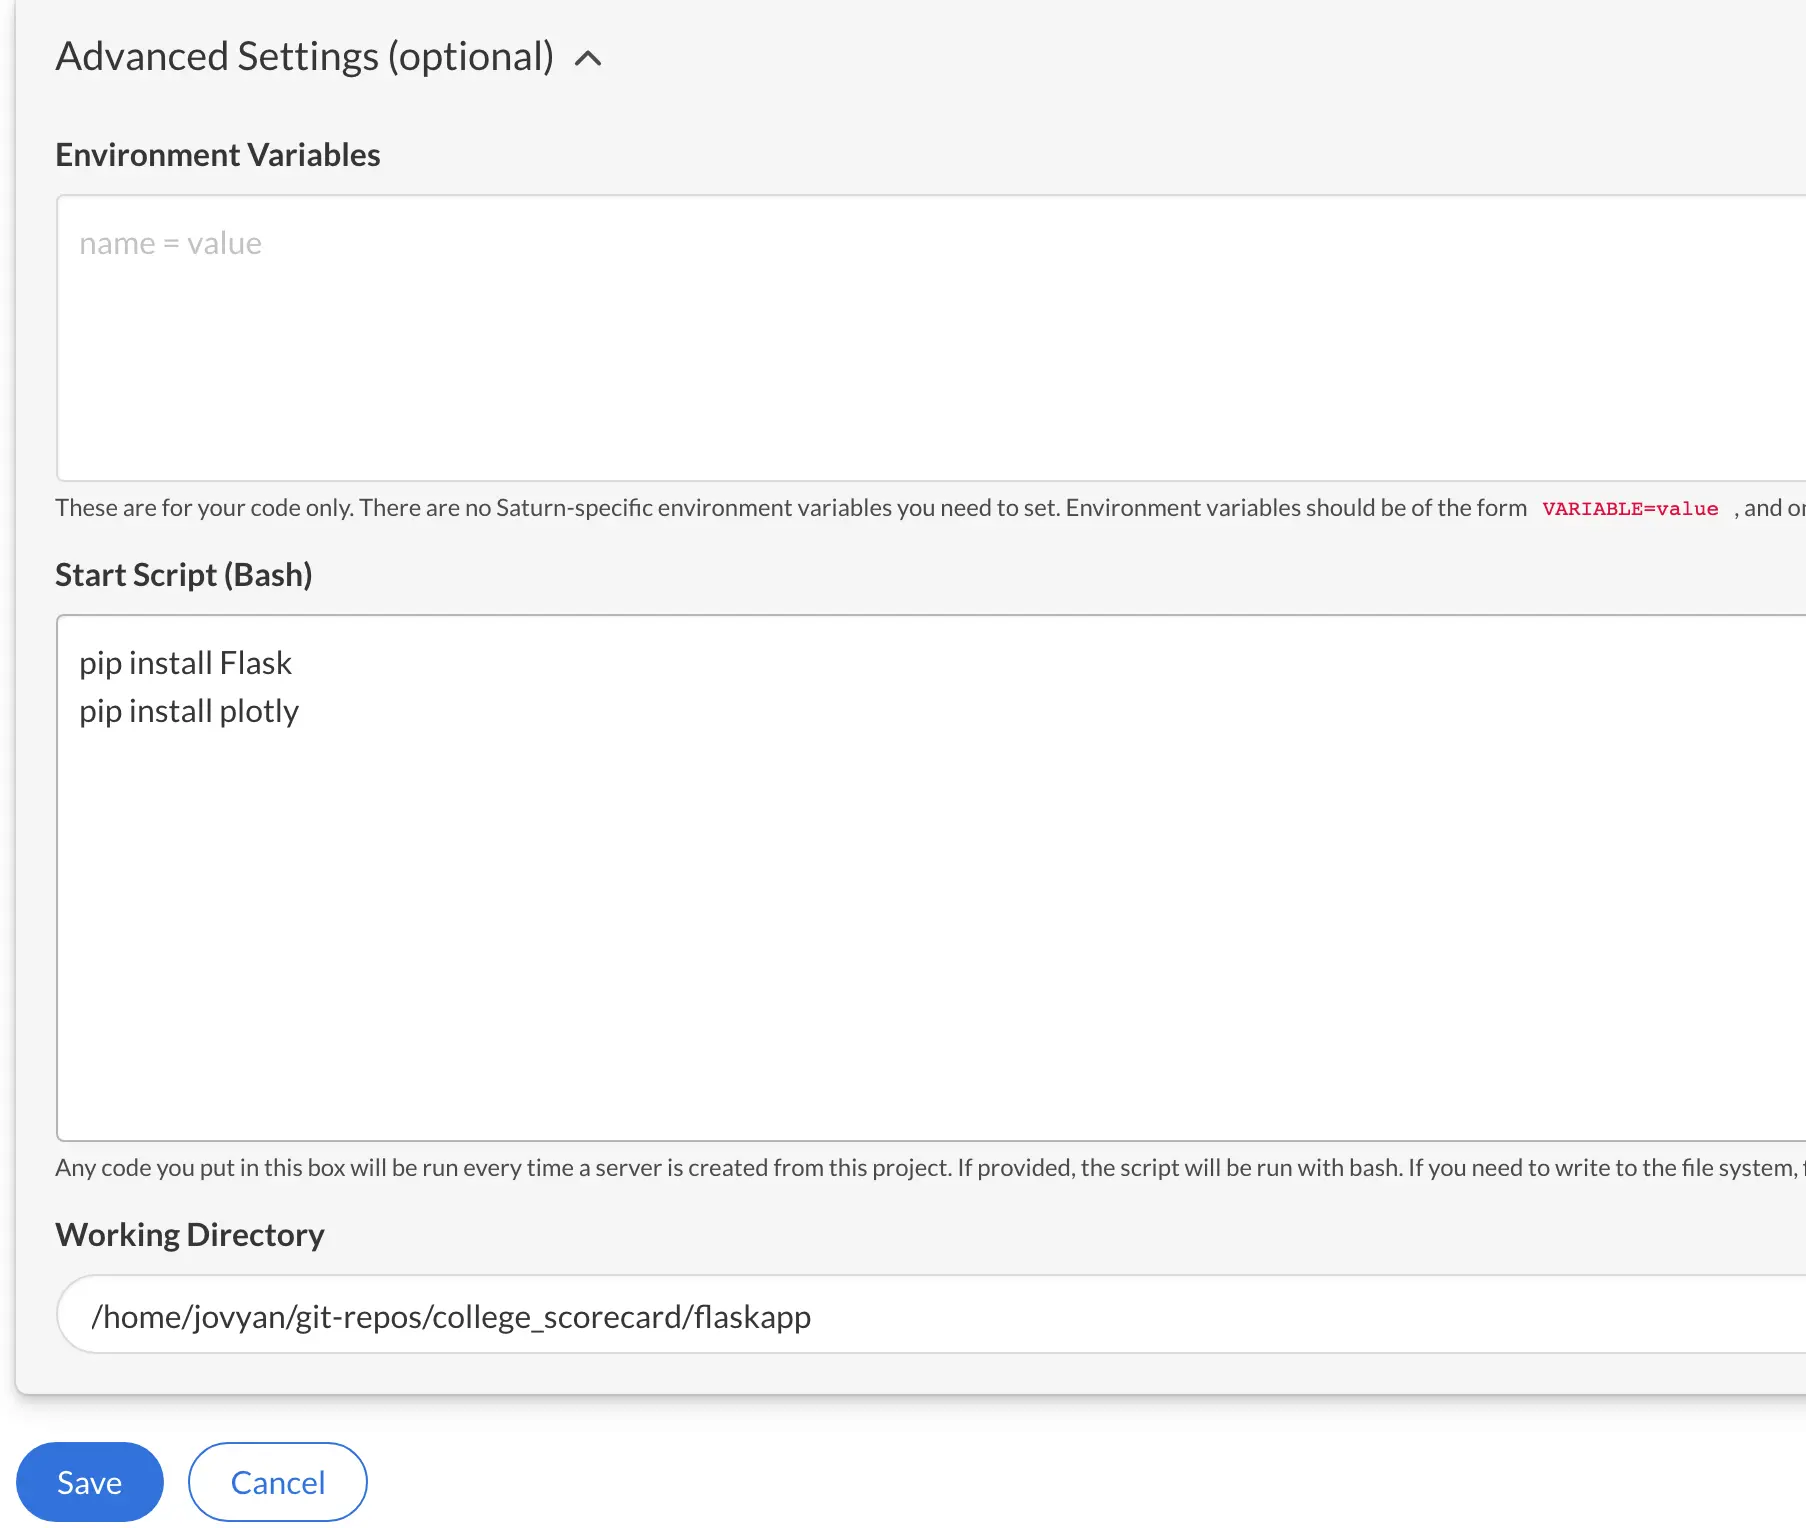
Now we can deploy this app very similarly to how we deployed the Voila application — in the same project even if we want to!
The Saturn Cloud project already has our Github repository attached, but if you need to do this step again, just check out our docs. This is how your deployment will find the code.
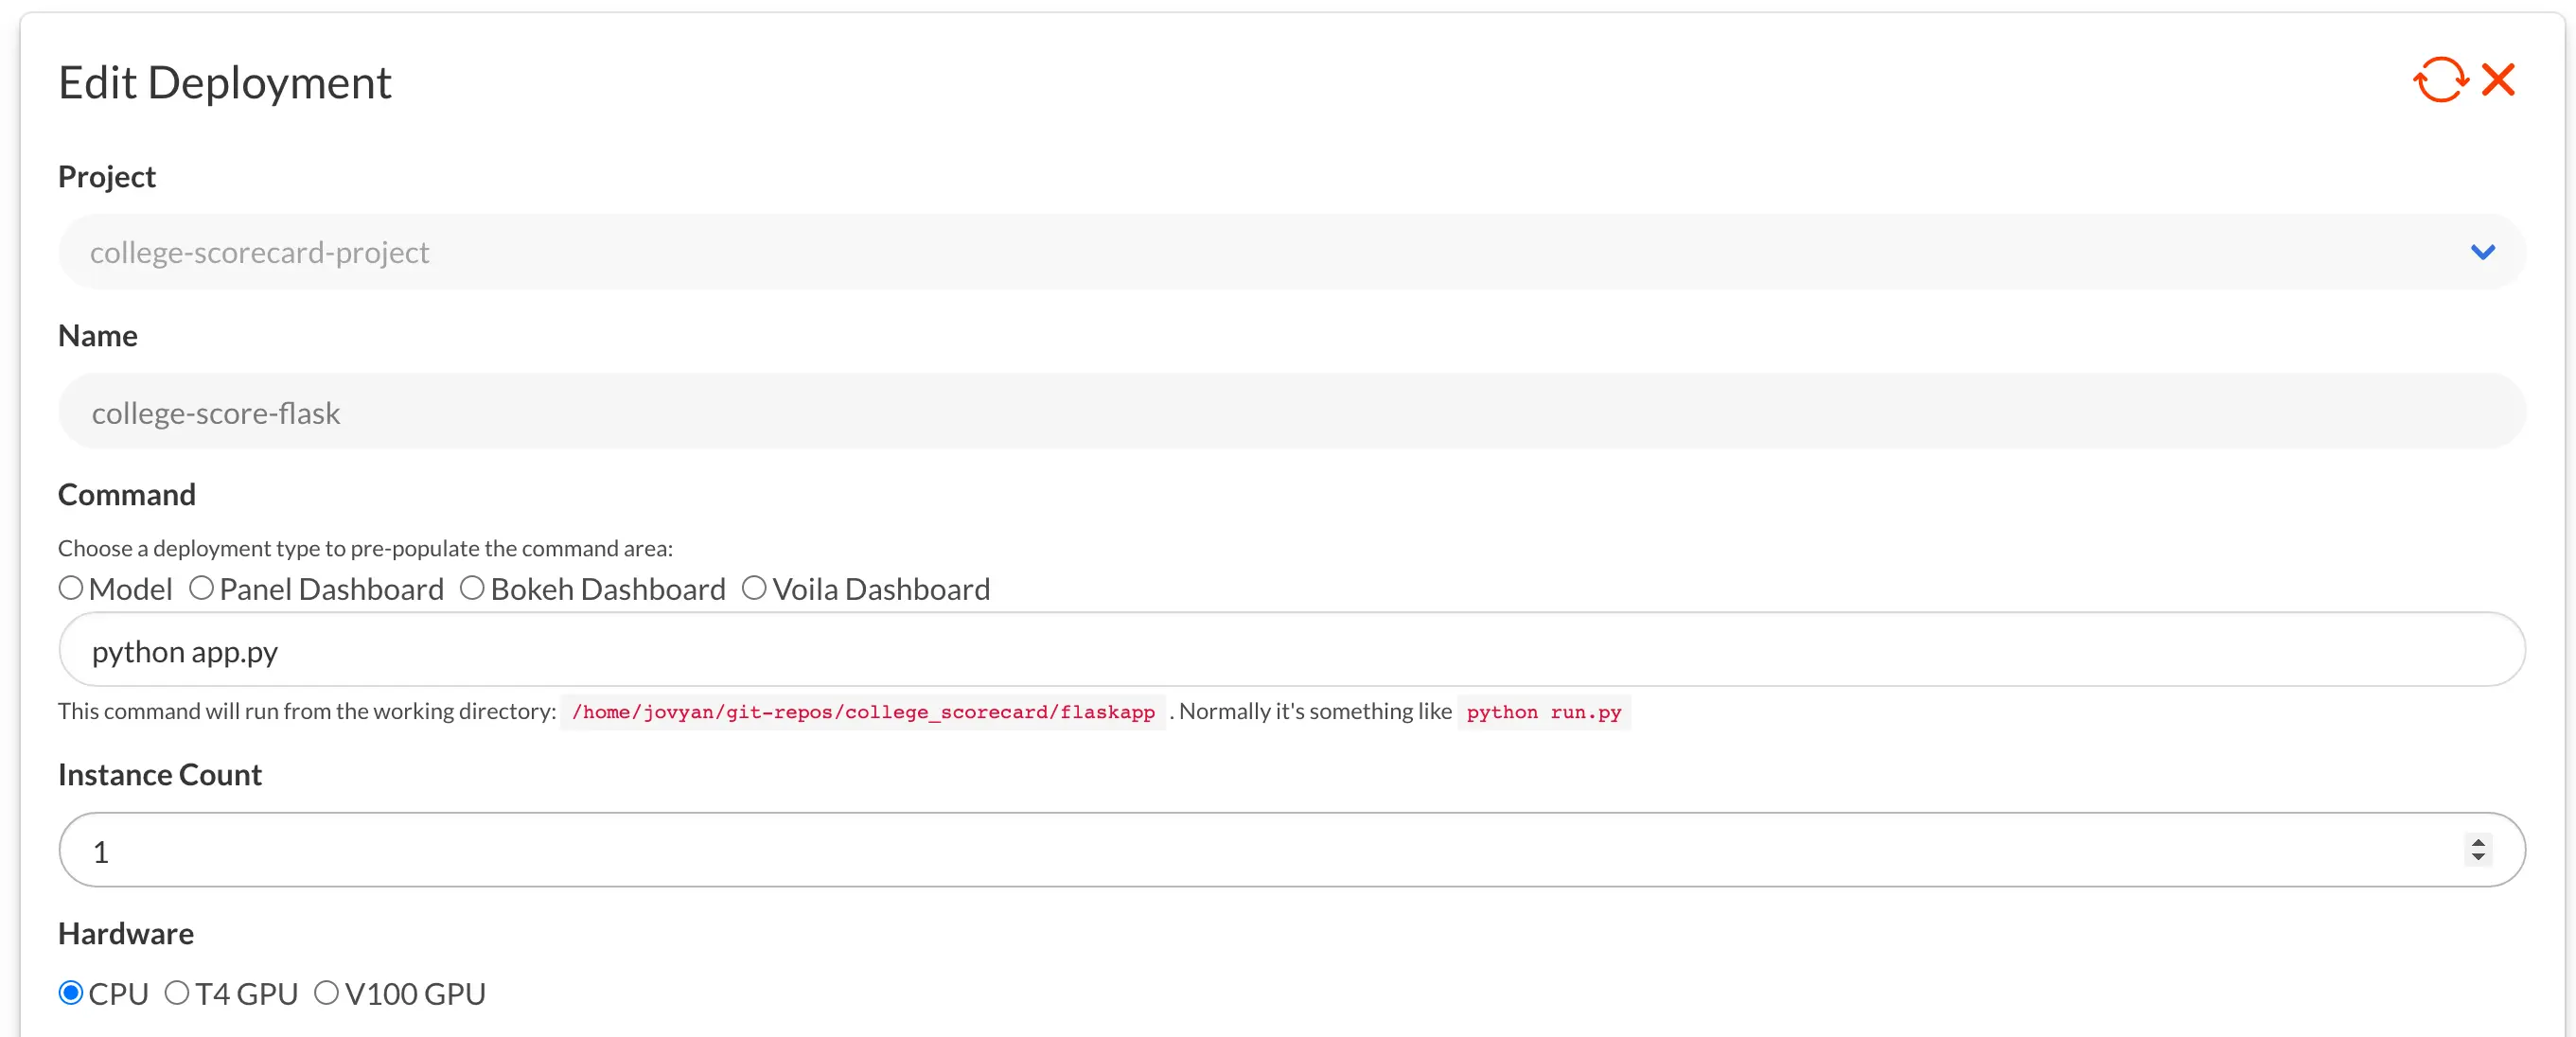
The command for deploying Flask is different from Voila — but remember that the address and port are the same. You just set that already in your app.py script instead of in the deployment.

Now you are ready! Save, click the green Start arrow, and your deployment will start up.

This form will accept your viewer’s inputs, and then it will either return JSON results, if you’re making an API, or will take them to your results page.

See it in Action!
If you have a Saturn Cloud account, you can see the Flask web application running live now, or see the Flask REST API.Conclusion
With that, you have deployed a model! This technique can work for lots of different types of model, and if you’d like to try it on Saturn Cloud, we would love to have you join us. Check out our getting started documentation for more guides, and consider whether our Saturn Hosted Free, Saturn Hosted Pro, or Enterprise plan is best for you!
If you missed the earlier posts in this series, read Part 1 here and Part 2 here.
Thank you to Danil Shostak on Unsplash for the header image for this post!
About Saturn Cloud
Saturn Cloud is your all-in-one solution for data science & ML development, deployment, and data pipelines in the cloud. Spin up a notebook with 4TB of RAM, add a GPU, connect to a distributed cluster of workers, and more. Request a demo today to learn more.
Saturn Cloud provides customizable, ready-to-use cloud environments for collaborative data teams.
Try Saturn Cloud and join thousands of users moving to the cloud without
having to switch tools.


