
Photo by Fatos Bytyqi on Unsplash
When working on a Machine Learning or a Deep Learning Problem, loss/cost functions are used to optimize the model during training. The objective is almost always to minimize the loss function. The lower the loss the better the model. Cross-Entropy loss is a most important cost function. It is used to optimize classification models. The understanding of Cross-Entropy is pegged on understanding of Softmax activation function. I have put up another article below to cover this prerequisite.
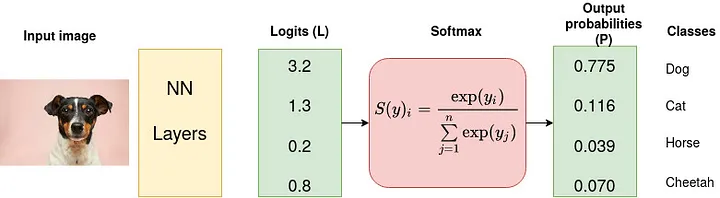
Consider a 4-class classification task where an image is classified as either a dog, cat, horse or cheetah.
Input image source: Photo by Victor Grabarczyk on Unsplash.
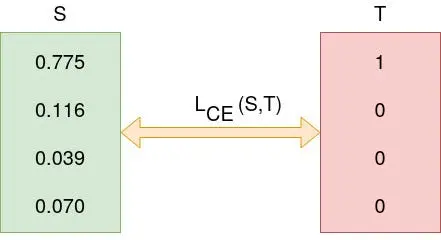
In the above Figure, Softmax converts logits into probabilities. The purpose of the Cross-Entropy is to take the output probabilities (P) and measure the distance from the truth values (as shown in Figure below).

Cross Entropy (L) (Source: Author).
For the example above the desired output is [1,0,0,0] for the class dog but the model outputs [0.775, 0.116, 0.039, 0.070] .
The objective is to make the model output be as close as possible to the desired output (truth values). During model training, the model weights are iteratively adjusted accordingly with the aim of minimizing the Cross-Entropy loss. The process of adjusting the weights is what defines model training and as the model keeps training and the loss is getting minimized, we say that the model is learning.
The concept of cross-entropy traces back into the field of Information Theory where Claude Shannon introduced the concept of entropy in 1948. Before diving into Cross-Entropy cost function, let us introduce entropy .
Entropy
Entropy of a random variable X is the level of uncertainty inherent in the variables possible outcome.
For p(x) — probability distribution and a random variable X, entropy is defined as follows
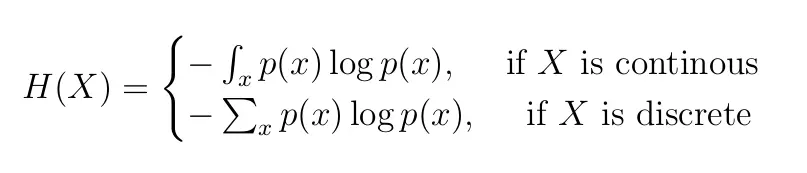
Equation 1: Definition of Entropy. Note log is calculated to base 2.
Reason for negative sign: log(p(x))<0 for all p(x) in (0,1) . p(x) is a probability distribution and therefore the values must range between 0 and 1.

A plot of log(x). For x values between 0 and 1, log(x) <0 (is negative).
The greater the value of entropy, H(x) , the greater the uncertainty for probability distribution and the smaller the value the less the uncertainty.
Example
Consider the following 3 “containers” with shapes: triangles and circles
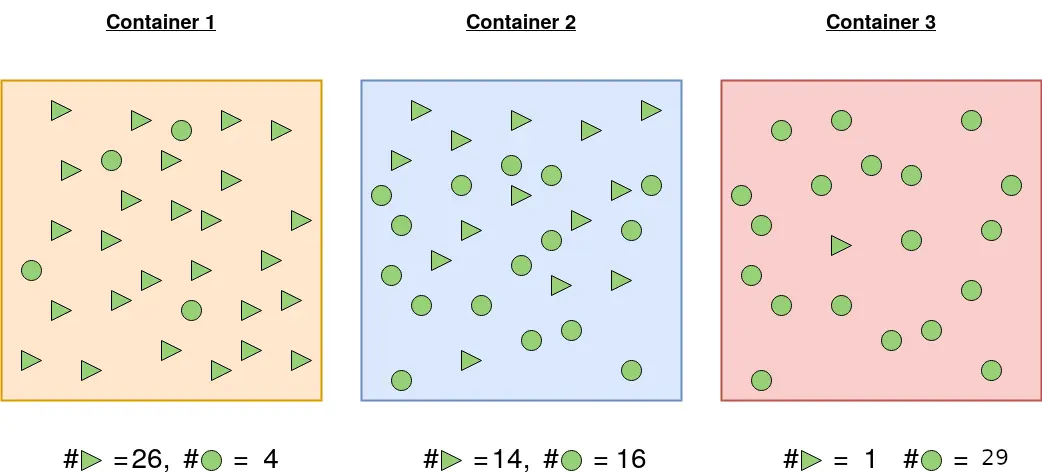
3 containers with triangle and circle shapes.
Container 1: The probability of picking a triangle is 26/30 and the probability of picking a circle is 4/30. For this reason, the probability of picking one shape and/or not picking another is more certain.
Container 2: Probability of picking the a triangular shape is 14/30 and 16/30 otherwise. There is almost 50–50 chance of picking any particular shape. Less certainty of picking a given shape than in 1.
Container 3: A shape picked from container 3 is highly likely to be a circle. Probability of picking a circle is 29/30 and the probability of picking a triangle is 1/30. It is highly certain than the shape picked will be circle.
Let us calculate the entropy so that we ascertain our assertions about the certainty of picking a given shape.
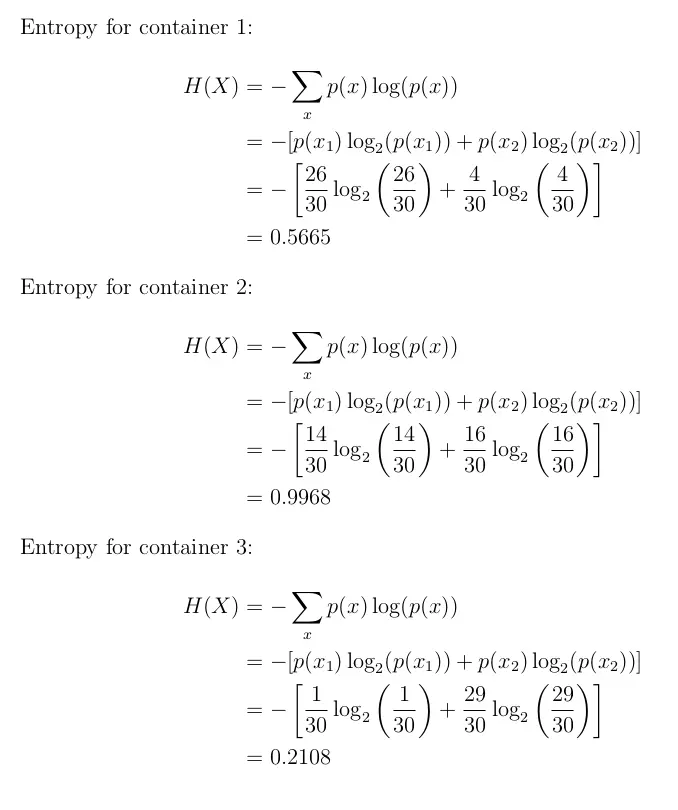
As expected the entropy for the first and third container is smaller than the second one. This is because probability of picking a given shape is more certain in container 1 and 3 than in 2. We can now go ahead to discuss Cross-Entropy loss function.
Cross-Entropy Loss Function
Also called logarithmic loss, log loss or logistic loss. Each predicted class probability is compared to the actual class desired output 0 or 1 and a score/loss is calculated that penalizes the probability based on how far it is from the actual expected value. The penalty is logarithmic in nature yielding a large score for large differences close to 1 and small score for small differences tending to 0.
Cross-entropy loss is used when adjusting model weights during training. The aim is to minimize the loss, i.e, the smaller the loss the better the model. A perfect model has a cross-entropy loss of 0.
Cross-entropy is defined as
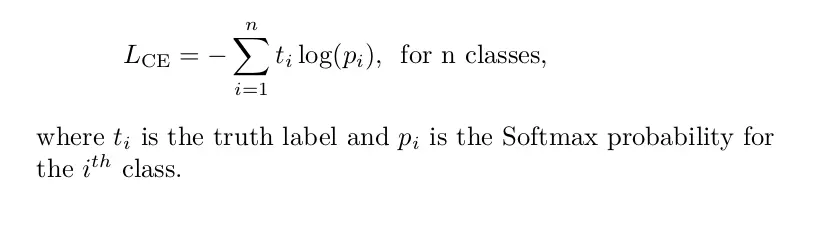
Equation 2: Mathematical definition of Cross-Entropy. Note the log is calculated to base 2, that is the same as ln().
Binary Cross-Entropy Loss
For binary classification (a classification task with two classes — 0 and 1), we have binary cross-entropy defined as
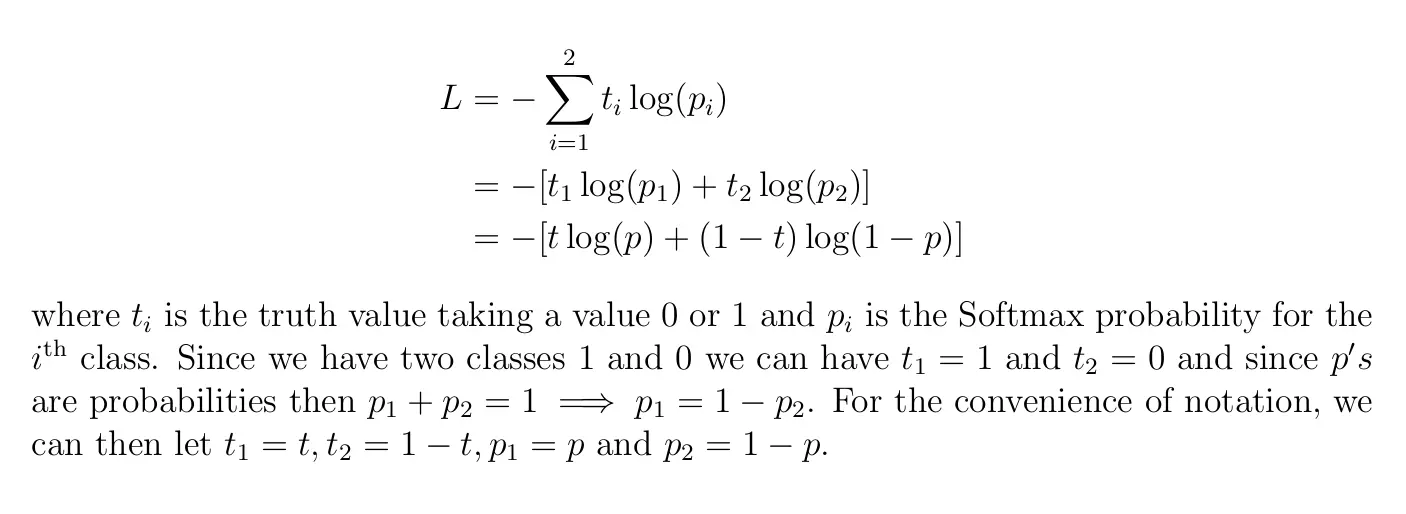
Equation 3: Mathematical Binary Cross-Entropy.
Binary cross-entropy is often calculated as the average cross-entropy across all data examples, that is,
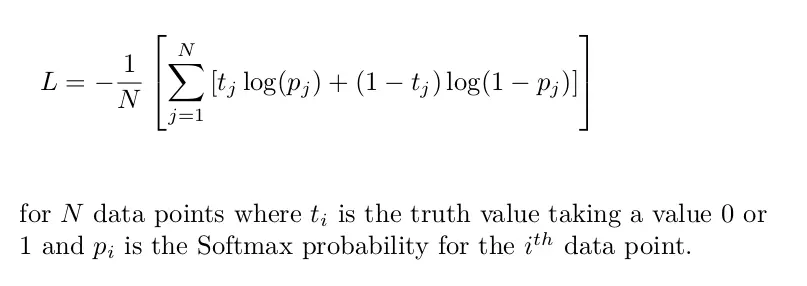
Equation 4
Example
Consider the classification problem with the following Softmax probabilities (S) and the labels (T). The objective is to calculate for cross-entropy loss given these information.
Logits(S) and one-hot encoded truth label(T) with Categorical Cross-Entropy loss function used to measure the ‘distance’ between the predicted probabilities and the truth labels.
The categorical cross-entropy is computed as follows
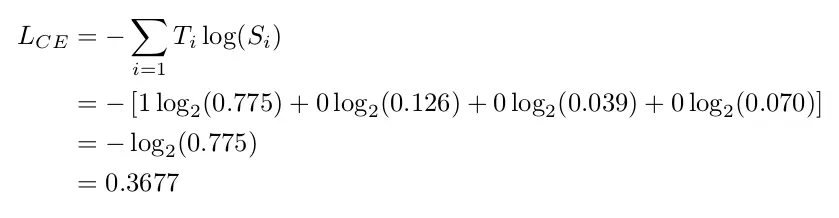
Softmax is continuously differentiable function. This makes it possible to calculate the derivative of the loss function with respect to every weight in the neural network. This property allows the model to adjust the weights accordingly to minimize the loss function (model output close to the true values).
Assume that after some iterations of model training the model outputs the following vector of logits


0.095 is less than previous loss, that is, 0.3677 implying that the model is learning. The process of optimization (adjusting weights so that the output is close to true values) continues until training is over.
Keras provides the following cross-entropy loss functions: binary, categorical, sparse categorical cross-entropy loss functions.
Categorical Cross-Entropy and Sparse Categorical Cross-Entropy
Both categorical cross entropy and sparse categorical cross-entropy have the same loss function as defined in Equation 2. The only difference between the two is on how truth labels are defined.
Categorical cross-entropy is used when true labels are one-hot encoded, for example, we have the following true values for 3-class classification problem
[1,0,0],[0,1,0]and[0,0,1].In sparse categorical cross-entropy , truth labels are integer encoded, for example,
[1],[2]and[3]for 3-class problem.
Thanks for reading :-)