Python Matplotlib Make 3D Plot Interactive in Jupyter Notebook

As data scientists and software engineers, we often work with large datasets and need to visualize the data to make sense of it. Matplotlib is a popular choice for creating static, animated, and interactive visualizations in Python. In this blog post, we will dive into creating interactive 3D plots in Jupyter Notebook using Matplotlib. This guide assumes you have a basic understanding of Python, Matplotlib, and Jupyter Notebook.
Table of Contents
- Introduction to 3D Plotting in Matplotlib
- Setting Up Your Jupyter Notebook Environment
- Creating a 3D Scatter Plot
- Making the 3D Plot Interactive
- Conclusion
Introduction to 3D Plotting in Matplotlib
Matplotlib provides a variety of 3D plotting functions that allow us to create surface plots, wireframe plots, scatter plots, and more. These plots can be helpful in visualizing relationships between three variables or exploring the structure of complex data.
To create 3D plots in Matplotlib, we first need to import the Axes3D class from the mpl_toolkits.mplot3d module. This class is used to create 3D axes that can be added to a Matplotlib figure.
from mpl_toolkits.mplot3d import Axes3D
Once we’ve imported the necessary module, we can create a 3D plot by adding a 3D axis to a Matplotlib figure.
Setting Up Your Jupyter Notebook Environment
Before we start creating our 3D plot, it’s essential to set up the Jupyter Notebook environment to display the plot correctly. We need to import the necessary libraries and enable the %matplotlib widget magic command to make the plots interactive.
import numpy as np
import matplotlib.pyplot as plt
from mpl_toolkits.mplot3d import Axes3D

%matplotlib widget
Now that our environment is ready, let’s create a 3D scatter plot and make it interactive.
Creating a 3D Scatter Plot
For demonstration purposes, we’ll use a simple dataset containing three variables: x, y, and z. We’ll generate random data for these variables and create a 3D scatter plot.
# Generating random data
np.random.seed(42)
x = np.random.randint(0, 100, size=100)
y = np.random.randint(0, 100, size=100)
z = np.random.randint(0, 100, size=100)

# Creating a 3D scatter plot
fig = plt.figure()
ax = fig.add_subplot(111, projection='3d')
ax.scatter(x, y, z, c='r', marker='o')

ax.set_xlabel('X Label')
ax.set_ylabel('Y Label')
ax.set_zlabel('Z Label')

plt.show()
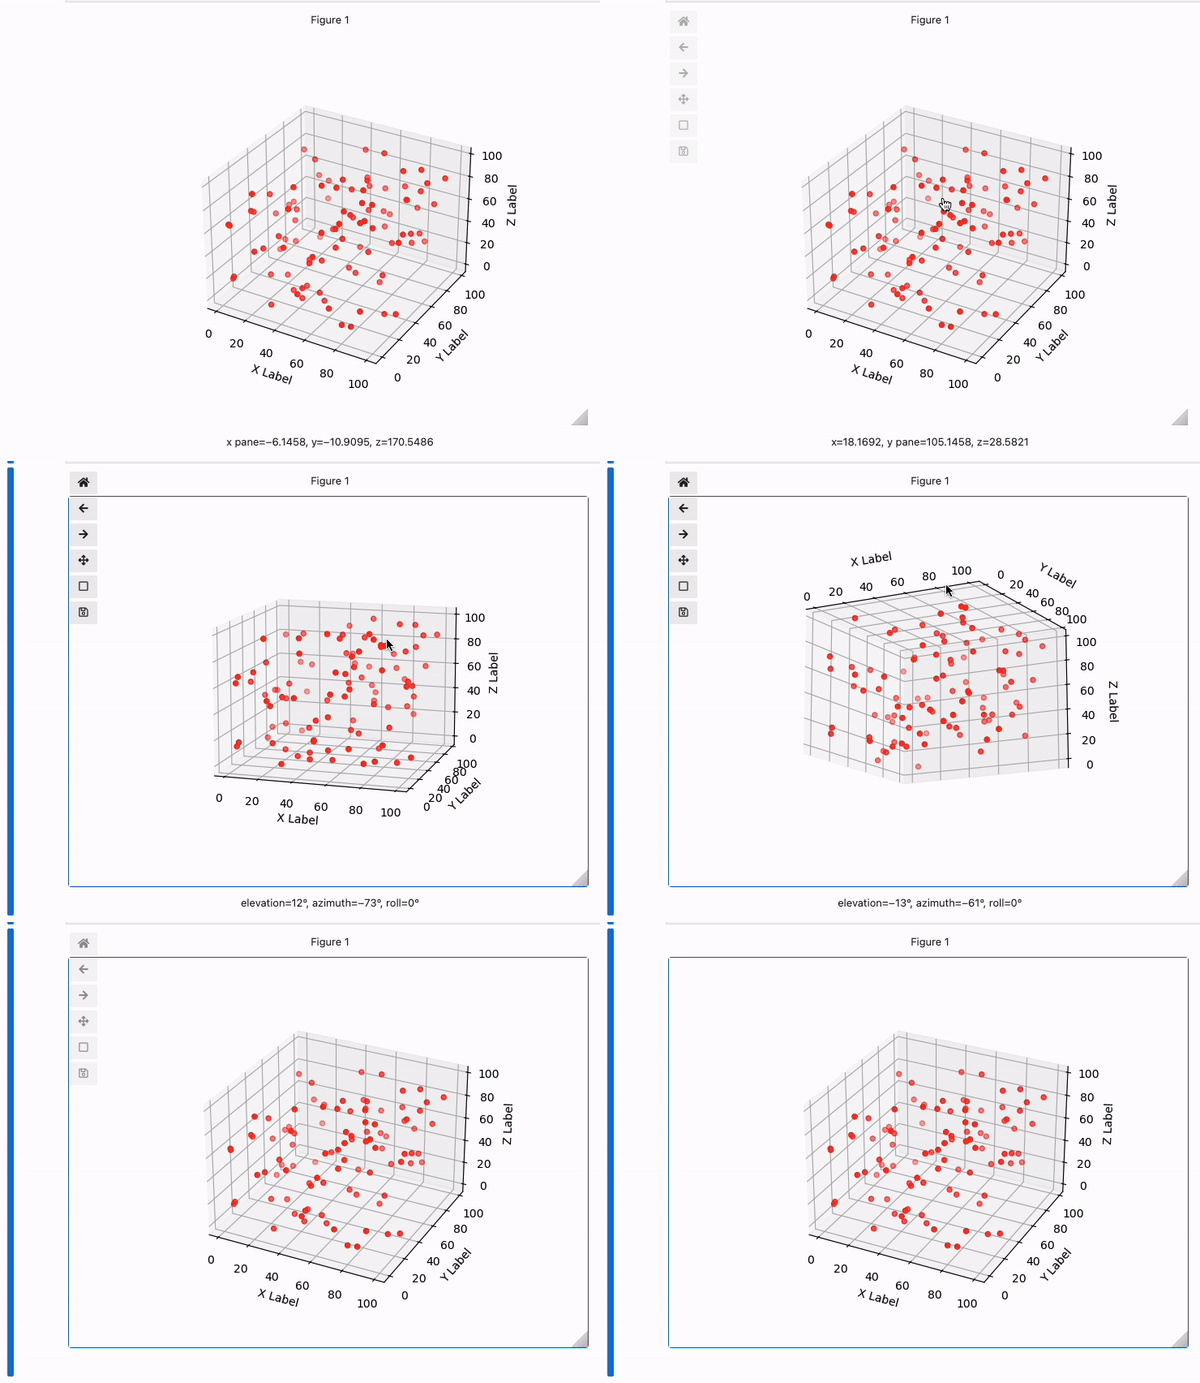
At this point, you should see a 3D scatter plot displayed in your Jupyter Notebook. However, it’s not interactive yet. Let’s fix that.

Making the 3D Plot Interactive
To make our 3D plot interactive, we need to use the %matplotlib widget magic command, which we’ve already enabled at the beginning of this post. This command allows us to rotate, zoom, and pan the plot using our mouse or trackpad.
Note that the %matplotlib widget magic command should be placed in a separate cell before importing Matplotlib and generating the plot. If you’ve followed the instructions so far, your plot should already be interactive.
If you’re unable to interact with the plot, make sure you’ve enabled the %matplotlib widget magic command and re-run the cells containing the imports and plot generation.
Now you should be able to explore your 3D plot by clicking and dragging to rotate, scrolling to zoom in and out, and right-clicking and dragging to pan.
Conclusion
In this blog post, we’ve covered how to create an interactive 3D plot in Jupyter Notebook using Python and Matplotlib. By following these steps, you can create visually appealing and interactive 3D plots to better understand and analyze your data.
Remember that the key to creating interactive 3D plots in Jupyter Notebook is to enable the %matplotlib widget magic command before importing Matplotlib and generating the plot. This command allows you to interact with the plot using your mouse or trackpad, making it easier to explore the data in three dimensions.
Feel free to experiment with different types of 3D plots and customize the appearance to suit your needs.
About Saturn Cloud
Saturn Cloud is your all-in-one solution for data science & ML development, deployment, and data pipelines in the cloud. Spin up a notebook with 4TB of RAM, add a GPU, connect to a distributed cluster of workers, and more. Request a demo today to learn more.
Saturn Cloud provides customizable, ready-to-use cloud environments for collaborative data teams.
Try Saturn Cloud and join thousands of users moving to the cloud without
having to switch tools.


