
This article was published when data science tooling like Dask and R was a primary focus for Saturn Cloud. Today, Saturn Cloud is the enterprise AI platform for any GPU infrastructure.
As data scientists and software engineers, we often come across situations where our data doesn’t fit well with a linear regression model. In such cases, we need to explore other alternatives, such as nonlinear regression. Nonlinear regression is a powerful technique that allows us to fit a wider range of data sets than linear regression. In this blog post, we will explore a simple method to fit your data better using nonlinear regression in Python.
Table of Contents
- Introduction
- Understanding the Basics of Nonlinear Regression
- Fitting Nonlinear Regression Models in Python
- Conclusion
Understanding the Basics of Nonlinear Regression
Nonlinear regression is a statistical method that models the relationship between a dependent variable and one or more independent variables. Unlike linear regression, which assumes a linear relationship between the dependent and independent variables, nonlinear regression allows for more complex relationships that can be modeled using nonlinear functions.
Nonlinear functions can take many forms, such as polynomial, exponential, logarithmic, or trigonometric functions. The choice of function depends on the nature of the data and the research question. In general, the goal of nonlinear regression is to find the best-fit parameters of the chosen function that minimize the sum of the squared errors between the predicted values and the actual values.
Fitting Nonlinear Regression Models in Python
Python provides several libraries for fitting nonlinear regression models, such as SciPy, Statsmodels, and Scikit-learn. In this blog post, we will focus on the SciPy library, which has a simple and intuitive interface for fitting nonlinear regression models.
Step 1: Import Required Libraries
Before we start, we need to import the required libraries. In this example, we will use the NumPy and Matplotlib libraries for data manipulation and visualization, respectively, and the SciPy library for fitting the nonlinear regression model.
import numpy as np
import matplotlib.pyplot as plt
from scipy.optimize import curve_fit
Step 2: Generate Sample Data
To demonstrate the nonlinear regression method, we will generate some sample data using a quadratic function with some added noise. We will use the NumPy library to generate the data.
# Generate sample data
np.random.seed(0)
x = np.linspace(-5, 5, num=50)
y = 2.0 + 1.5 * x + 3.0 * x**2 + np.random.normal(scale=3.0, size=x.shape)
The generated data contains 50 points that follow a quadratic function with some added noise.
Step 3: Define the Nonlinear Function
Next, we need to define the nonlinear function that we want to fit to the data. In this example, we will use a quadratic function.
# Define the nonlinear function
def quadratic_func(x, a, b, c):
    return a + b * x + c * x**2
The quadratic function takes three parameters: a, b, and c, and returns the predicted values for a given input x.
Step 4: Fit the Nonlinear Model
Now we are ready to fit the nonlinear model to the data using the curve_fit function from the SciPy library. The curve_fit function takes the nonlinear function, the input data, and the output data, and returns the best-fit parameters of the function.
# Fit the nonlinear model
popt, pcov = curve_fit(quadratic_func, x, y)
The popt variable contains the best-fit parameters of the quadratic function. We can use these parameters to predict the values of the function for any given input x.
Step 5: Visualize the Results
Finally, we can visualize the results of the nonlinear regression using the Matplotlib library. We will plot the original data points and the predicted values of the quadratic function.
# Visualize the results
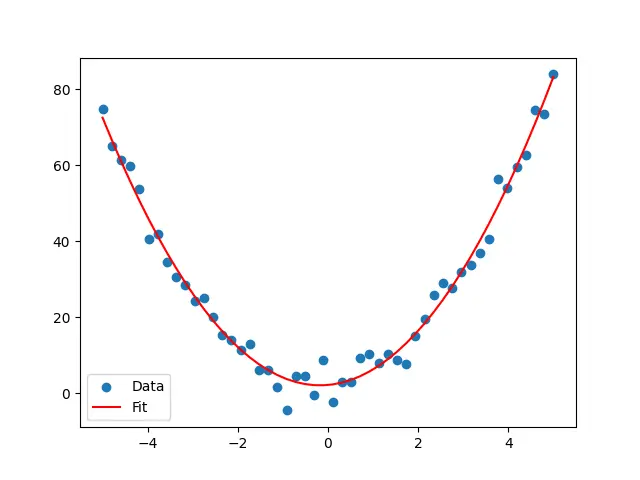
plt.scatter(x, y, label='Data')
plt.plot(x, quadratic_func(x, *popt), 'r-', label='Fit')
plt.legend()
plt.show()
The resulting plot shows the original data points in blue and the predicted values of the quadratic function in red.
Conclusion
In conclusion, nonlinear regression is a powerful technique that allows us to fit a wider range of data sets than linear regression. Python provides several libraries for fitting nonlinear regression models, such as SciPy, Statsmodels, and Scikit-learn. In this blog post, we focused on the SciPy library, which has a simple and intuitive interface for fitting nonlinear regression models.
To fit a nonlinear regression model in Python, we need to follow these steps:
- Import the required libraries
- Generate sample data
- Define the nonlinear function
- Fit the nonlinear model
- Visualize the results
By following these steps, we can easily fit a nonlinear regression model to our data and obtain better results than with linear regression.

