
Matplotlib is a powerful Python library that allows data scientists to create a wide range of static, animated, and interactive plots. One common requirement is to make all text elements bold for better readability and emphasis. This blog post will guide you through the process of making everything bold in Matplotlib using Python.
Table of Contents
- Introduction to Matplotlib
- Making Text Elements Bold in Matplotlib
- Making Specific Text Elements Bold
- Making Tick Labels Bold
- Best Practices
- Conclusion
Introduction to Matplotlib
Matplotlib is a plotting library for Python. It provides an object-oriented API for embedding plots into applications using general-purpose GUI toolkits like Tkinter, wxPython, Qt, or GTK. Matplotlib is also a popular library for creating static, animated, and interactive visualizations in Python.
Making Text Elements Bold in Matplotlib
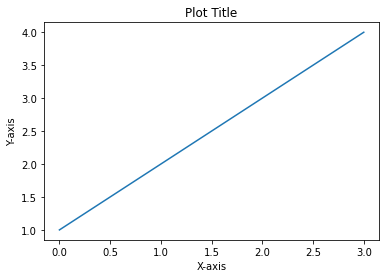
Let’s consider an example below, at first, everything is not being bold.
import matplotlib.pyplot as plt
plt.plot([1, 2, 3, 4])
plt.xlabel('X-axis')
plt.ylabel('Y-axis')
plt.title('Plot Title')
plt.show()
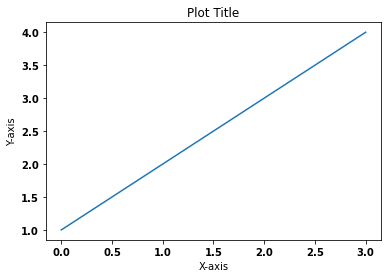
To make all text elements bold in Matplotlib, we need to adjust the font properties. Here’s a simple example:
import matplotlib.pyplot as plt
from matplotlib import rcParams

rcParams['font.weight'] = 'bold'

plt.plot([1, 2, 3, 4])
plt.xlabel('X-axis')
plt.ylabel('Y-axis')
plt.title('Plot Title')
plt.show()
 In this code snippet, we first import the necessary modules. Then, we use the
 rcParams dictionary to set the font weight to ‘bold’. This will apply to all text elements in the plot.
Making Specific Text Elements Bold
If you want to make specific text elements bold, such as the title or axis labels, you can do so by setting the weight parameter in the respective function calls. Here’s how:
plt.title('Plot Title', weight='bold')
plt.xlabel('X-axis', weight='bold')
plt.ylabel('Y-axis', weight='bold')
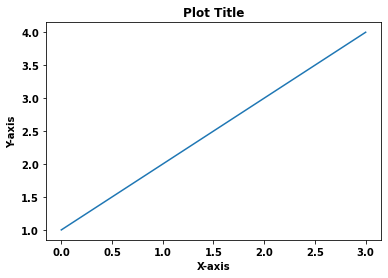
In this example, only the title and axis labels will be bold.
Making Tick Labels Bold
To make the tick labels bold, you need to get the tick labels first and then set their font properties. Here’s how:
ax = plt.gca()
for tick in ax.get_xticklabels():
    tick.set_fontweight('bold')
for tick in ax.get_yticklabels():
    tick.set_fontweight('bold')

In this code snippet, gca() is used to get the current axes, and get_xticklabels() and get_yticklabels() are used to get the x and y tick labels, respectively. Then, we set their font weight to ‘bold’.
Best Practices
- Use bold text sparingly to avoid overwhelming the viewer.
- Consider the readability of your plot; too much emphasis can distract from the main message.
- Experiment with different weights and styles to find the best visual representation for your data.
Conclusion
Making text elements bold in Matplotlib is a straightforward process. By adjusting the font properties, you can make all text elements bold or only specific ones. This can greatly enhance the readability and emphasis of your plots.
This blog post is part of a series on Python data visualization. Stay tuned for more posts on this topic.

