How to Use Python and Pandas with Yahoo Finance API

As a data scientist or software engineer, you may have come across the need to access financial data for analysis or modeling. Yahoo Finance API provides a simple and easy-to-use interface for accessing financial data. In this tutorial, we will guide you through the steps of using Python and Pandas to retrieve and manipulate financial data using Yahoo Finance API.
Table of Contents
- What is Yahoo Finance API?
- Prerequisites
- Retrieving financial data using Yahoo Finance API
- Common Errors and Troubleshooting
- Conclusion
What is Yahoo Finance API?
Yahoo Finance API is a free financial data API that provides real-time stock quotes, historical data, and financial news for stocks, bonds, currencies, commodities, and indices. The API offers a range of endpoints that allow you to access data in various formats such as JSON, CSV, and XML. Yahoo Finance API is widely used by financial analysts, traders, and data scientists to retrieve financial data for analysis and modeling.
Prerequisites
Before we begin, make sure you have the following installed:
- Python 3.x
- Pandas
- Requests library
You can install Pandas and yfinance libraries using pip:
pip install pandas
pip install yfinance
Retrieving financial data using Yahoo Finance API
After its installation, the yfinance package can be imported into Python code. The Ticker, representing the company’s unique identifier, needs to be passed as an argument.
Note: A stock symbol or ticker is a distinct sequence of letters assigned to a security for trading purposes. Examples include:
- Amazon: “AMZN”
- Meta: “META”
- Google: “GOOGL”
- Apple: “AAPL”
Retrieving real-time stock quotes
Below are various examples that depict how to retrieve Financial Data from Yahoo Finance:
Let us take the results for Apple and hence use the “AAPL” ticker.
import yfinance as yf
# create ticker for Apple Stock
ticker = yf.Ticker('AAPL')
# get data of the most recent date
todays_data = ticker.history(period='1d')

print(todays_data)
Output:
                                 Open   High         Low       Close   Volume  \
Date
2023-11-21 00:00:00-05:00  191.410004  191.5  190.369995  190.369995  8691997

                           Dividends  Stock Splits
Date
2023-11-21 00:00:00-05:00        0.0           0.0
This Python code uses the yfinance library to retrieve the historical stock data for Apple Inc. (AAPL) for the most recent date ('1d' corresponds to one day) using the history method of the Ticker object.
Retrieving historical data
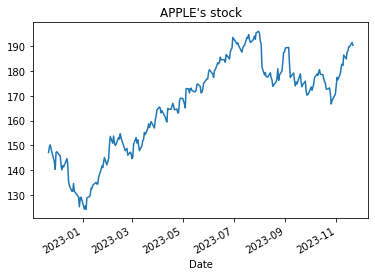
To obtain historical data, you can either specify the duration (by modifying the 1d in the previous example to the desired period) or define a specific time range.
- Changing
1dto1y
ticker = yf.Ticker('AAPL')
# get data of the most recent date
aapl_df = ticker.history(period='1y')
# plot the close price
aapl_df['Close'].plot(title="APPLE's stock")
- Specifying the period
import datetime

# startDate , as per our convenience we can modify
startDate = datetime.datetime(2023, 1, 1)

# endDate , as per our convenience we can modify
endDate = datetime.datetime(2023, 12, 31)
apple_data = yf.Ticker('AAPL')
# pass the parameters as the taken dates for start and end
aapl_df = apple_data.history(start=startDate, end=endDate)
# plot the close price
aapl_df['Close'].plot(title="APPLE's stock")
Output:

Retrieving mutiple stocks data
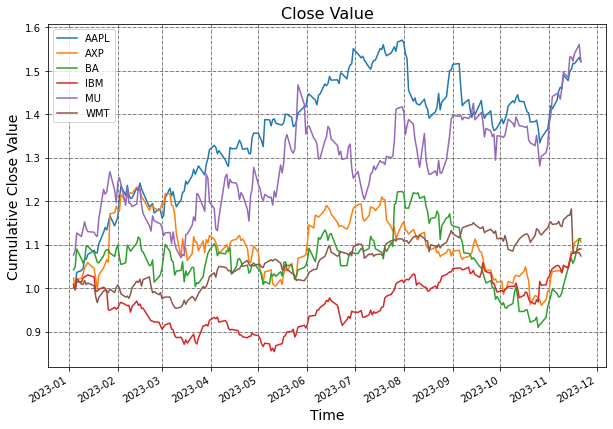
In the following code, we will retrieve data for multiple stocks and store it in a DataFrame named data. Subsequently, we will compute the daily returns and use the Matplotlib package to plot the cumulative returns for all the stock prices.
# Define the ticker list
import pandas as pd
tickers_list = ['AAPL', 'WMT', 'IBM', 'MU', 'BA', 'AXP']

# Fetch the data
import yfinance as yf
data = yf.download(tickers_list,'2023-1-1')['Adj Close']

# Plot all the close prices
((data.pct_change()+1).cumprod()).plot(figsize=(10, 7))
plt.legend()
plt.title("Close Value", fontsize=16)

# Define the labels
plt.ylabel('Cumulative Close Value', fontsize=14)
plt.xlabel('Time', fontsize=14)

# Plot the grid lines
plt.grid(which="major", color='k', linestyle='-.', linewidth=0.5)
plt.show()
Output:

Common Errors and Troubleshooting:
Error: Connection Issues:
Ensure a stable internet connection and handle potential connection errors using exception handling.
try:
    df = yf.download('AAPL')
except Exception as e:
    print(f"Error: {e}")
Error: Invalid Ticker Symbol:
Check for typos or ensure the ticker symbol is valid before making requests.
try:
    df = yf.download('INVALID_SYMBOL')
except Exception as e:
    print(f"Error: {e}")
Error: Incomplete Data:
Handle missing or incomplete data gracefully, considering options like data interpolation or filling.
# Interpolate missing values
df.interpolate(inplace=True)
Conclusion
In this tutorial, we have shown you how to use Python and Pandas with Yahoo Finance API to retrieve financial data. Yahoo Finance API provides a simple and easy-to-use interface for accessing financial data, making it an ideal tool for data scientists and software engineers working with financial data. By following the steps outlined in this tutorial, you can quickly and easily retrieve financial data using Python and Pandas.
About Saturn Cloud
Saturn Cloud is a portable AI platform that installs securely in any cloud account. Build, deploy, scale and collaborate on AI/ML workloads-no long term contracts, no vendor lock-in.
Saturn Cloud provides customizable, ready-to-use cloud environments
for collaborative data teams.
Try Saturn Cloud and join thousands of users moving to the cloud without having to switch tools.


