
Data visualization is a crucial aspect of data science. It helps us understand complex data sets and draw insights from them. One such visualization technique is vector plotting, which is particularly useful in fields like physics, engineering, and machine learning. In this blog post, we will explore how to plot vectors in Python using Matplotlib, a powerful data visualization library.
Table of Contents
- Introduction
- Introduction to Matplotlib
- Getting Started with Matplotlib
- Plotting Vectors Using Matplotlib
- Conclusion
- References
Introduction to Matplotlib
Matplotlib is a multi-platform, data visualization library built on NumPy arrays and designed to work with the broader SciPy stack. It was conceived by John Hunter in 2002 to enable a MATLAB-like interface for plotting in Python. Matplotlib is capable of creating static, animated, and interactive plots in several styles, making it one of the most used Python libraries.
Getting Started with Matplotlib
Before we dive into vector plotting, let’s ensure that you have Matplotlib installed. If not, you can install it using pip:
pip install matplotlib
Or with conda:
conda install matplotlib
Plotting Vectors Using Matplotlib
To plot vectors, we will use the quiver function from the pyplot module of Matplotlib. The quiver function is used to create 2D field or velocity plots and is perfect for our purpose of vector plotting.
Here’s a simple example of how to plot a vector:
import matplotlib.pyplot as plt
import numpy as np

# Create a single vector
V = np.array([1,1])

# Create the plot
fig, ax = plt.subplots()

# Add the vector V to the plot
ax.quiver(0, 0, V[0], V[1], angles='xy', scale_units='xy', scale=1, color='r')

# Set the x-limits and y-limits of the plot
ax.set_xlim([-2, 2])
ax.set_ylim([-2, 2])

# Show the plot along with the grid
plt.grid()
plt.show()
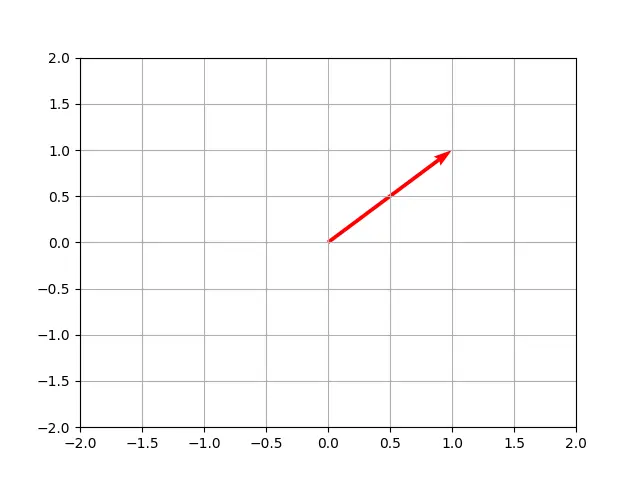
In this example, we’ve plotted a single vector V starting from the origin (0,0) and ending at the point (1,1). The quiver function takes the starting points of the vectors (in this case, 0,0) and the components of the vectors (in this case, 1,1) as parameters.
Plotting Multiple Vectors
You can also plot multiple vectors on the same graph. Here’s how:
# Create multiple vectors
V = np.array([1,1])
W = np.array([-2,-1])

fig, ax = plt.subplots()

# Add vectors V and W to the plot
ax.quiver(0, 0, V[0], V[1], angles='xy', scale_units='xy', scale=1, color='r')
ax.quiver(0, 0, W[0], W[1], angles='xy', scale_units='xy', scale=1, color='b')

ax.set_xlim([-3, 3])
ax.set_ylim([-3, 3])

plt.grid()
plt.show()
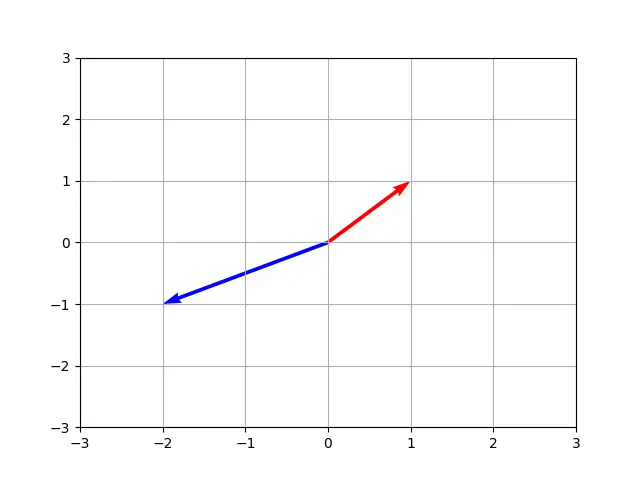
In this example, we’ve added a second vector W to the plot. The red vector represents V, and the blue vector represents W.
Conclusion
Vector plotting is a powerful tool for visualizing data, especially in fields where direction and magnitude are important. Matplotlib’s quiver function provides an easy and efficient way to plot vectors in Python. By mastering this function, you can add another tool to your data visualization toolkit.
