
This article was published when data science tooling like Dask and R was a primary focus for Saturn Cloud. Today, Saturn Cloud is the enterprise AI platform for any GPU infrastructure.
As a data scientist or software engineer, you may often encounter situations where you need to visualize large amounts of data in a meaningful way. One such visualization technique is a heatmap, which is a graphical representation of data using colors to represent different values. In this tutorial, we will learn how to create a heatmap from a Pandas DataFrame using Python.
Table of Contents
- What is a Heatmap?
- How to Create a Heatmap from a Pandas DataFrame
- Pros and Cons of Creating Heatmaps from Pandas DataFrame
- Error Handling in Creating Heatmaps from Pandas DataFrame
- Conclusion
What is a Heatmap?
A heatmap is a graphical representation of data in which values are represented by colors. Heatmaps are commonly used in data analysis to visualize large datasets and to identify patterns and trends in the data.
In a heatmap, each cell of the matrix is colored according to its value. The color scale can range from a single color, such as white or black, to a gradient of colors that represents a range of values.
Heatmaps are particularly useful for identifying clusters and patterns in data, such as in gene expression analysis or in stock market data analysis.
How to Create a Heatmap from a Pandas DataFrame
Creating a heatmap from a Pandas DataFrame is a straightforward process in Python. We will be using the seaborn library, which is a Python data visualization library based on matplotlib.
Step 1: Install Required Libraries
To create a heatmap from a Pandas DataFrame, we need to install the required libraries first. You can install the libraries using pip command in the terminal.
pip install pandas seaborn matplotlib
Step 2: Import Required Libraries
After installing the required libraries, we need to import them into our Python script. We will be using the following libraries:
import pandas as pd
import seaborn as sns
import matplotlib.pyplot as plt
Step 3: Load Data into Pandas DataFrame
The next step is to load the data into a Pandas DataFrame. For this tutorial, we will be using the flights dataset, which is a built-in dataset in seaborn. We can load the dataset using the following code:
flights = sns.load_dataset("flights")
Step 4: Reshape Data into a Matrix
To create a heatmap, we need to reshape the data into a matrix format. We can do this using the pivot_table() function in Pandas. The pivot_table() function creates a new DataFrame by reshaping the original DataFrame according to the given parameters.
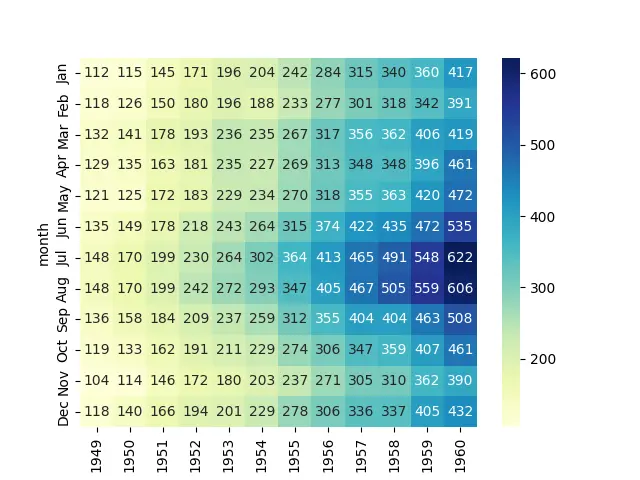
For our example, we will pivot the flights DataFrame to create a new DataFrame with months as rows and years as columns. The values in the new DataFrame will be the number of passengers for each month and year.
flights_matrix = flights.pivot_table(index="month", columns="year", values="passengers")
Step 5: Create a Heatmap
Finally, we can create a heatmap using the heatmap() function in seaborn. We can customize the color scheme of the heatmap using the cmap parameter. The annot parameter can be set to True to display the data values in each cell of the heatmap.
sns.heatmap(flights_matrix, cmap="YlGnBu", annot=True, fmt="0.0f")
plt.show()
The resulting heatmap will be displayed in a new window.
Pros and Cons of Creating Heatmaps from Pandas DataFrame:
Pros
Visualizing Large Datasets: Heatmaps are effective for visualizing large datasets by representing data values with colors. This allows data scientists and software engineers to quickly identify patterns, trends, and variations in the data.
Pattern Recognition: Heatmaps excel at highlighting patterns and clusters within the data, making them particularly useful for tasks such as gene expression analysis, stock market data analysis, and other scenarios where identifying trends is crucial.
Intuitive Interpretation: The color-based representation in heatmaps provides an intuitive way to interpret data. Users can easily identify high and low values, variations, and relationships between different elements in the dataset.
Customization Options: Heatmaps offer customization options, allowing users to choose color scales, adjust annotations, and tailor the visualization to meet specific needs. This flexibility enhances the ability to convey information effectively.
Cons
Color Sensitivity: Interpretation of heatmaps relies heavily on color perception. Individuals with color vision deficiencies may face challenges in accurately distinguishing between different color shades, impacting the effectiveness of the visualization.
Loss of Granularity: While heatmaps provide a high-level overview of data trends, they may lose granularity, making it challenging to analyze individual data points or outliers in detail.
Potential Misinterpretation: Depending on the chosen color scale, users may unintentionally emphasize or de-emphasize certain aspects of the data. Care should be taken to choose a color scale that accurately reflects the nature of the data.
Error Handling in Creating Heatmaps from Pandas DataFrame:
Data Type Mismatch: Ensuring that the data types within the Pandas DataFrame are appropriate for the heatmap is essential. Mismatched data types may result in errors during the visualization process.
Missing Data Handling: Heatmaps may not handle missing or NaN values gracefully. It’s important to preprocess the data and handle missing values appropriately before creating the heatmap.
Incorrect Reshaping: If there are issues with reshaping the data into the required matrix format, errors may occur. Users should double-check the parameters used for reshaping, such as those in the pivot_table() function.
Choosing Appropriate Color Scales: The choice of color scale can significantly impact the interpretation of the heatmap. Users should carefully select color scales that align with the nature of the data and avoid color combinations that may lead to misinterpretation.
Conclusion
In this tutorial, we learned how to create a heatmap from a Pandas DataFrame using Python. We used the seaborn library to create the heatmap and the flights dataset as an example. Heatmaps are a powerful visualization technique that can be used to identify patterns and trends in large datasets. By following the steps outlined in this tutorial, you can easily create a heatmap from any Pandas DataFrame in Python.

