
This article was published when data science tooling like Dask and R was a primary focus for Saturn Cloud. Today, Saturn Cloud is the enterprise AI platform for any GPU infrastructure.
As a data scientist or software engineer, you may find yourself working with large datasets in Python using the Pandas library. In such cases, it is often important to highlight specific cells or ranges of cells in your dataset that meet certain conditions. This is where conditional formatting comes in.
Conditional formatting is the process of formatting cells based on certain conditions. It is commonly used in spreadsheets to highlight cells that meet certain criteria, but it can also be applied to data frames in Pandas. In this article, we will explore how to conditionally format cells in Pandas using Python.
Table of Contents
- Introduction
- What is Conditional Formatting in Pandas?
- How to Conditionally Format Cells in Pandas
- Pros and Cons of Conditional Formatting in Pandas
- Error Handling
- Conclusion
What is Conditional Formatting in Pandas?
Conditional formatting in Pandas allows you to apply formatting to cells in a data frame based on certain conditions. This can be useful for highlighting outliers, visualizing trends, or emphasizing important data points. Pandas provides several methods for applying conditional formatting, including:
- style.map()
- Styler.apply()
- Styler.highlight_max()
- Styler.highlight_min()
- Styler.background_gradient()
These methods allow you to apply different types of formatting, including font size, color, and background color, based on a range of user-defined conditions.
How to Conditionally Format Cells in Pandas
To demonstrate how to conditionally format cells in Pandas, we will be working with a sample data frame containing information about the performance of various stocks. The data frame has the following structure:
import pandas as pd

stocks = pd.DataFrame({
    'Stock': ['AAPL', 'AMZN', 'GOOG', 'FB', 'TSLA'],
    'Price': [145.86, 3422.00, 2530.66, 341.37, 656.95],
    'PE Ratio': [28.63, 81.46, 30.80, 29.57, 326.03],
    'Dividend Yield': [0.6, 0.0, 0.0, 0.0, 0.0],
    'Market Cap': [2.42, 1.73, 1.71, 0.97, 0.63]
})
Our goal is to highlight the stocks with the highest and lowest market capitalization in the data frame.
Using style.map()
The first method we will explore is style.map(). This method allows you to apply a function to each cell in the data frame and return a new data frame with the formatted cells. Here is an example of how to use style.map() to highlight the highest and lowest market cap stocks:
def highlight_max_min(val):
    if val == stocks['Market Cap'].max():
        return 'background-color: green'
    elif val == stocks['Market Cap'].min():
        return 'background-color: red'
    else:
        return ''

stocks.style.map(highlight_max_min, subset=pd.IndexSlice[:, ['Market Cap']])
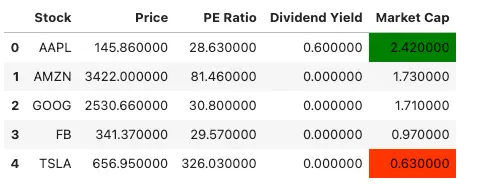
In this example, we define a function called highlight_max_min() that takes a cell value as input and returns a string containing the CSS style for the cell. If the cell value is equal to the maximum market cap value in the data frame, the function returns a green background color. If the cell value is equal to the minimum market cap value, the function returns a red background color. Otherwise, the function returns an empty string.
We then apply the highlight_max_min() function to the ‘Market Cap’ column using the style.map() method and pass the resulting styled data frame to the display() function.
Using Styler.apply()
The Styler.apply() method is similar to style.map(), but it allows you to apply a function to each row or column in the data frame instead of each cell. Here is an example of how to use Styler.apply() to highlight the highest and lowest market cap stocks:
def highlight_max_min(row):
    max_value = row['Market Cap'].max()
    min_value = row['Market Cap'].min()
    return ['background-color: green' if val == max_value
            else 'background-color: red' if val == min_value
            else '' for val in row]

stocks.style.apply(highlight_max_min, axis=1, subset=pd.IndexSlice[:, ['Market Cap']])
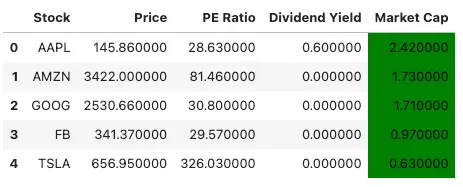
In this example, we define a function called highlight_max_min() that takes a row as input and returns a list of CSS styles for each cell in the row. We first calculate the maximum and minimum market cap values in the row using the max() and min() methods, respectively. We then use a list comprehension to apply the appropriate CSS style to each cell in the row based on its value.
We then apply the highlight_max_min() function to the ‘Market Cap’ column using the Styler.apply() method and pass the resulting styled data frame to the display() function.
Using Styler.highlight_max() and Styler.highlight_min()
The Styler.highlight_max() and Styler.highlight_min() methods provide a simpler way to highlight the highest and lowest values in a data frame. Here is an example of how to use these methods to highlight the highest and lowest market cap stocks:
stocks.style.highlight_max(subset=pd.IndexSlice[:, ['Market Cap']], color='green') \
      .highlight_min(subset=pd.IndexSlice[:, ['Market Cap']], color='red')
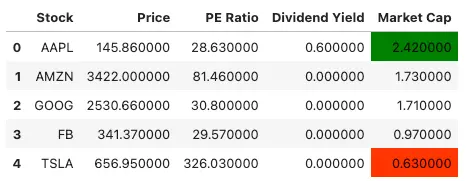
In this example, we use the Styler.highlight_max() and Styler.highlight_min() methods to highlight the highest and lowest market cap values in the data frame, respectively. We pass the ‘Market Cap’ column to the subset parameter to apply the highlighting only to that column. We also specify the colors for the highlighting using the color parameter.
Using Styler.background_gradient()
The Styler.background_gradient() method allows you to apply a gradient color scheme to a range of cells in a data frame based on their values. Here is an example of how to use Styler.background_gradient() to highlight the range of market cap values in the data frame:
stocks.style.background_gradient(subset=pd.IndexSlice[:, ['Market Cap']], cmap='Greens')
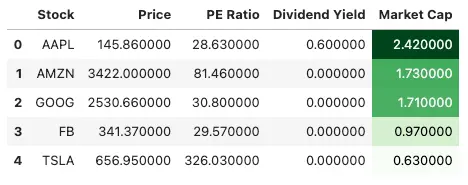
In this example, we use the Styler.background_gradient() method to apply a gradient color scheme to the ‘Market Cap’ column in the data frame. We pass the ‘Greens’ colormap to the cmap parameter to specify the color scheme.
Pros and Cons of Conditional Formatting in Pandas
Pros
Enhanced Visualization: Conditional formatting helps in visually emphasizing specific cells or ranges, making it easier for data scientists and software engineers to identify patterns, outliers, or important data points.
Improved Data Analysis: By highlighting cells based on certain conditions, you can quickly draw attention to significant information, aiding in more efficient data analysis and interpretation.
Customization Options: Pandas provides various methods like
style.map(),Styler.apply(), and others, offering flexibility in formatting options, such as font size, color, and background color. This customization helps tailor the visual representation to specific needs.User-Friendly Presentation: Conditional formatting enhances the readability of data frames, making it simpler for stakeholders and decision-makers to grasp insights from large datasets.
Cons
Potential for Overemphasis: While conditional formatting is a powerful tool, excessive use may lead to overemphasis on certain aspects, potentially diverting attention from the overall context of the data.
Limited to Visual Inspection: Conditional formatting is primarily a visual aid, and users need to visually inspect the formatted cells. For complex analyses, additional statistical methods or tools may be necessary for a comprehensive understanding.
Code Maintenance: Depending on the complexity of conditions and formatting rules, the code for conditional formatting can become intricate, potentially increasing the difficulty of maintenance and troubleshooting.
Performance Impact: Applying conditional formatting to large datasets may have a performance impact, especially if the formatting conditions involve complex computations.
Error Handling:
Undefined Conditions: Ensure that your formatting functions account for all possible conditions. If a condition is not explicitly defined, it should have a default behavior (returning an empty string, for example) to avoid unexpected outcomes.
Data Type Checks: Validate the data types within your formatting functions to prevent errors. Unexpected data types might cause issues when applying formatting rules.
Handling Missing Values: Consider how your formatting functions handle missing or NaN values. In some cases, you may want to explicitly check and handle these scenarios to prevent unexpected behavior.
Testing with Edge Cases: Before deploying formatted data for analysis or presentation, test your formatting functions with edge cases and extreme values to ensure they behave as expected and do not produce errors.
Conclusion
In this article, we have explored how to conditionally format cells in Pandas using Python. We have demonstrated several methods for applying conditional formatting, including style.map(), Styler.apply(), Styler.highlight_max(), Styler.highlight_min(), and Styler.background_gradient(). These methods allow you to apply different types of formatting, including font size, color, and background color, based on a range of user-defined conditions.
By mastering the art of conditional formatting in Pandas, you can enhance the visual appeal and clarity of your data analysis, making it easier to communicate key insights to stakeholders and decision-makers.

