
This article was published when data science tooling like Dask and R was a primary focus for Saturn Cloud. Today, Saturn Cloud is the enterprise AI platform for any GPU infrastructure.
Matplotlib is a powerful Python library for data visualization, widely used by data scientists and analysts. One of its many features is the ability to customize the appearance of plots, including the font size of colorbars. This blog post will guide you through the process of changing the font size of colorbars in Matplotlib, ensuring your visualizations are as clear and effective as possible.
Table of Contents
- Introduction to Matplotlib
- Understanding Colorbars
- Changing the Font Size of Colorbars
- Common Errors and Solutions
- Conclusion
Introduction to Matplotlib
Matplotlib is a plotting library for Python that provides a flexible platform to create a wide range of static, animated, and interactive plots. It’s a versatile tool that allows users to generate graphs, plots, charts, histograms, and much more with just a few lines of code.
Understanding Colorbars
A colorbar is a key component of many data visualizations. It provides a visual representation of the scale of values represented in a plot. In a heatmap, for example, the colorbar shows the relationship between the colors of the cells and their corresponding data values.
Changing the Font Size of Colorbars
Changing the font size of a colorbar in Matplotlib is a straightforward process. Here’s a step-by-step guide:
- Import the necessary libraries
import matplotlib.pyplot as plt
import numpy as np
- Create a sample plot
np.random.seed(0)
data = np.random.rand(10, 10)
plt.imshow(data, cmap='hot', interpolation='nearest')
- Add a colorbar
cbar = plt.colorbar()
- Change the font size
To change the font size of the colorbar, you can use the ax.tick_params method. This method allows you to change various parameters related to the ticks, including their font size.
cbar.ax.tick_params(labelsize=20)
In this line of code, labelsize=20 changes the font size of the colorbar labels to 20. You can adjust this value to suit your needs.
- Display the plot
Finally, use plt.show() to display the plot.
plt.show()
Here’s the complete code:
import matplotlib.pyplot as plt
import numpy as np

np.random.seed(0)
data = np.random.rand(10, 10)
plt.imshow(data, cmap='hot', interpolation='nearest')

cbar = plt.colorbar()
cbar.ax.tick_params(labelsize=20)

plt.show()
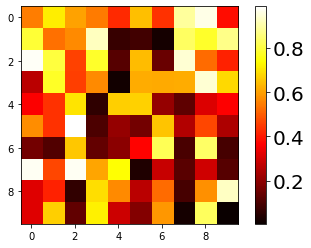
This will display a heatmap with a colorbar, where the colorbar labels have a font size of 20.
Certainly! Let’s add sections on common errors and solutions, as well as best practices for changing the font size of colorbars in Matplotlib.
Common Errors and Solutions
Error 1: "AttributeError: 'Colorbar' object has no attribute 'ax'"
Cause: This error occurs when trying to access the ax attribute on the colorbar object, but the colorbar does not have an ax attribute.
Solution: Instead of using cbar.ax.tick_params, directly use cbar.tick_params to modify the colorbar ticks and labels.
cbar = plt.colorbar()
cbar.tick_params(labelsize=20)
Error 2: "NameError: name 'labelsize' is not defined"
Cause: This error occurs when the specified parameter, in this case, labelsize, is not recognized.
Solution: Ensure that the parameter is correctly spelled and exists. In the provided code, labelsize is a valid parameter for tick_params.
cbar = plt.colorbar()
cbar.ax.tick_params(labelsize=20)
Error 3: No Change in Font Size
Cause: The font size may not change due to incorrect placement of the tick_params method or if it’s applied before the colorbar is created.
Solution: Make sure to call tick_params after creating the colorbar.
cbar = plt.colorbar()
cbar.ax.tick_params(labelsize=20)
Conclusion
Matplotlib offers a wide range of customization options for your data visualizations, including the ability to change the font size of colorbars. This feature allows you to tailor your plots to your audience’s needs, ensuring that your visualizations are as clear and effective as possible.
Remember, good data visualization is not just about presenting data; it’s about making it understandable. By customizing elements like colorbar font size, you can make your visualizations more accessible and easier to interpret.

