
This article was published when data science tooling like Dask and R was a primary focus for Saturn Cloud. Today, Saturn Cloud is the enterprise AI platform for any GPU infrastructure.
Table of Contents
- Introduction to Matplotlib Subplots
- Creating Basic Subplots
- Changing Subplot Size
- Advanced Subplot Size Adjustments
- Common Bugs/Errors:
- Conclusion
Introduction to Matplotlib Subplots
Matplotlib is a plotting library for Python that provides a variety of visualizations, from histograms and scatter plots to 3D plots. One of its most useful features is the ability to create subplots - multiple plots displayed in a single figure.
Subplots are ideal for comparing different datasets or visualizing different aspects of the same dataset. However, the default size of these subplots may not always be suitable for your needs. Fortunately, Matplotlib provides several ways to adjust subplot sizes.
Creating Basic Subplots
Before we delve into changing subplot sizes, let’s first create some basic subplots. We’ll use the pyplot.subplots() function, which returns a Figure object and an array of Axes objects.
import matplotlib.pyplot as plt
import matplotlib.image as mpimg
img = mpimg.imread('image.png')

fig, axs = plt.subplots(2, 2)  # Creates a 2x2 grid of subplots
axs[0,0].imshow(img)
axs[0,1].imshow(img)
axs[1,0].imshow(img)
axs[1,1].imshow(img)
plt.show()
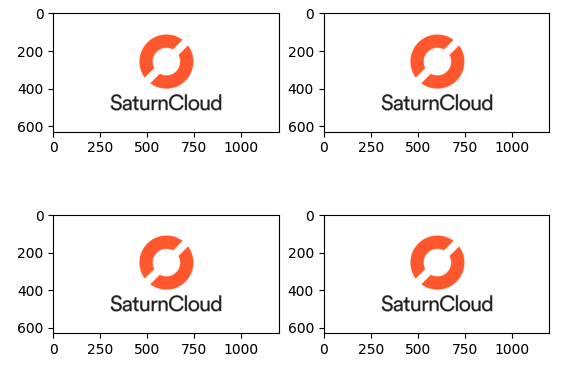
This code will create a 2x2 grid of subplots. However, you’ll notice that the plots are quite small, and the labels may overlap. This is where adjusting the subplot size becomes necessary.
Changing Subplot Size
The size of the entire figure containing the subplots can be adjusted using the figure(figsize=(width, height)) function, where width and height are in inches. This indirectly changes the size of the subplots.
fig, axs = plt.subplots(2, 2, figsize=(10, 10))  # Creates a 2x2 grid of subplots with a size of 10x10 inches
axs[0,0].imshow(img)
axs[0,1].imshow(img)
axs[1,0].imshow(img)
axs[1,1].imshow(img)
plt.show()
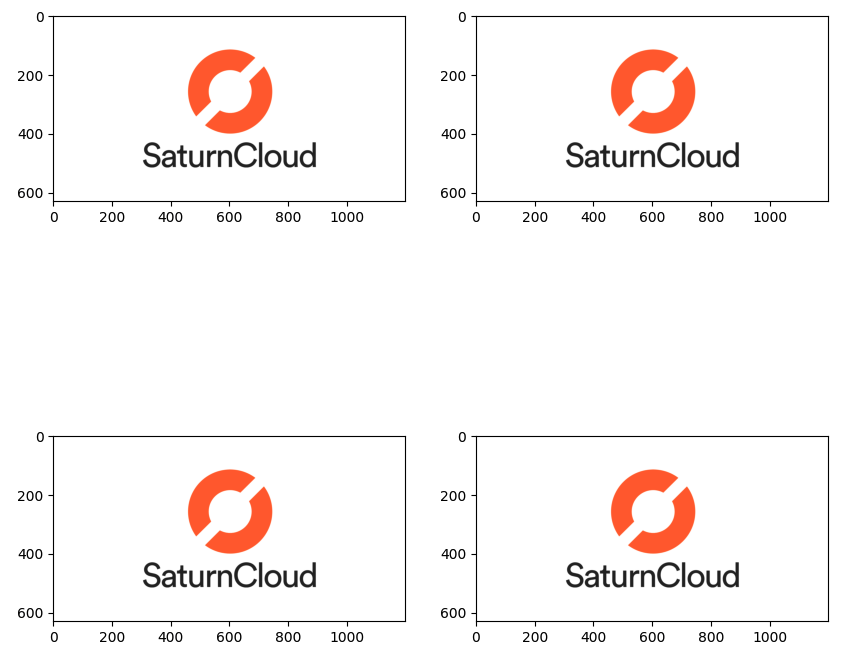
This will create larger subplots, but they will still have the same proportions. If you want to change the proportions of the subplots, you can use the subplot_adjust() function.
Advanced Subplot Size Adjustments
The subplot_adjust() function allows you to adjust the spacing between your subplots. It takes several arguments, including left, right, bottom, top, wspace (width space), and hspace (height space).
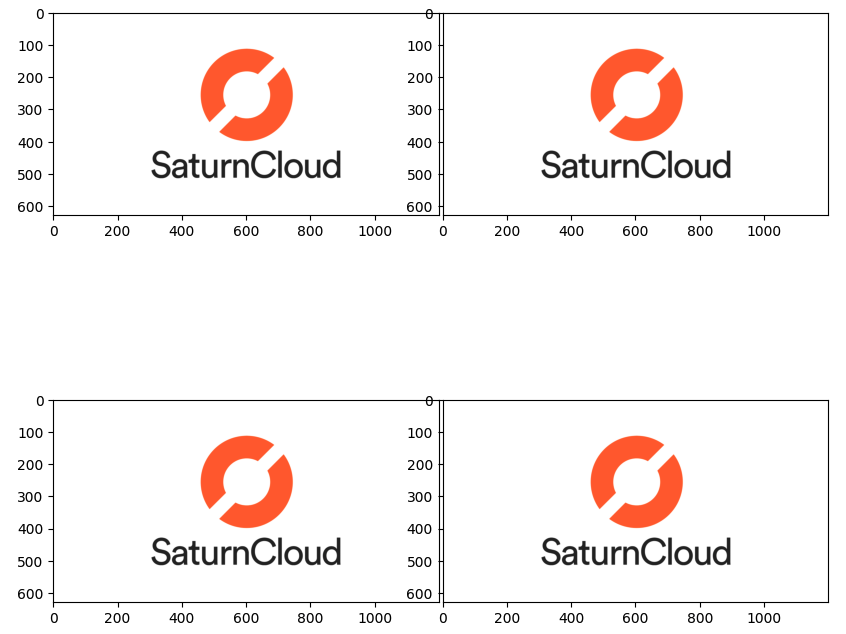
fig, axs = plt.subplots(2, 2, figsize=(10, 10))
plt.subplots_adjust(left=0.1, right=0.9, bottom=0.1, top=0.9, wspace=0.2, hspace=0.4)
plt.show()
This will create a 2x2 grid of subplots with a size of 10x10 inches, with specified spacing between the subplots.
Common Bugs/Errors:
Overlapping Labels:
Overlapping labels can occur when subplots are too close together.
To resolve this, adjust the hspace (horizontal space) and wspace (width space) parameters using the subplot_adjust() function. These parameters control the spacing between subplots.
Incorrect Proportions:
Incorrect proportions may arise when the specified ratios in width_ratios and height_ratios do not match the number of subplots or do not sum to the correct value. Ensure that the ratios are specified correctly to achieve the desired layout.
Conclusion
Adjusting subplot sizes in Matplotlib is a crucial skill for any data scientist or analyst. It allows you to create clear, readable visualizations that effectively communicate your data. Remember, the key to successful data visualization is not only in the data itself but also in how you present it.
Whether you’re creating a complex grid of subplots or a simple figure with just a couple of plots, understanding how to manipulate subplot size will help you create more effective visualizations. So, keep experimenting with different sizes and adjustments until you find what works best for your data.

